
Financial markets worldwide, especially the forex, attract many investors. It is one of the most volatile and liquid markets. It may give you glimmers of hope some days, but it can be dull for others. In my experience, the market demands strict trading discipline. The most important is to manage risk and how you play around it. In this guide, I will guide you through some market strategies of forex trading.
If you’re in the market to attain a stable output, you must form a long-term strategy. Contingent plans can help us to work around high-risk positions. It doesn’t matter if you’re a novice looking to explore the basics of the market or an experienced trader.
Focusing on and implementing the right strategies can sometimes become very critical. One more thing I found crucial in the market is that you must be flexible with your approach. Innovate and manage your risk. You can go big sometimes or stick to earn small percentages. It will all depend on the approach.
Understanding the Psychology of a Successful Forex Trader
Before adopting a successful forex trader’s mindset, let me simplify something. It would help if you had discipline and patience to succeed. It is not technical analysis or market trends that guarantee you success. Something beyond that is going to make you a good forex trader. In this blog, we will unveil those marketing strategies of forex.
A strong psychology or a mindset of a forex trader takes time to build. It will come through self-discipline, awareness, knowledge and practice. Emotional control is one of the most important things we overlook and acts as a game-changer. Emotions are generally high in humans. You need to take care of the two emotions, greed and fear, before becoming a successful trader.
- Fear can cause you to exit a trade before the optimal time. Trust me, you will face fear whenever you don’t trade as per your strategy.
- Greed can push you to take unnecessary risks. Something that can pay you someday, and on other days, it will wipe away your investment.
1. How to Cultivate a Winning Attitude in Forex Trading
Cultivating a winning attitude in forex trading is an ongoing, long-term process. The Forex market experiences significant volatility. Its high liquidity makes it an attractive market for investors around the world. Only strategies and sound risk management will not help you in the long run. Emotional control and self-discipline are also necessary.
Setting Realistic Goals
“Setting a realistic goal is not about limiting your potential. It’s about creating a path to sustainable success.”
Traders must set a goal they can manage; only then will they taste constant success. It may help a trader to stay focused and manage expectations as they approach the market. Here is how you can form realistic goals.
A. By Building Small and Gradual
This statement holds in almost every aspect of life. Always wish for something which you can manage or control.
For example, a small percentage of returns can help a beginner achieve a realistic goal. Focusing on something big can expose you to more significant risks. Go slow, step by step.
B. Focus on Consistency Rather on Big Wins
“The attraction of rapid wins will never be greater than small, steady advances.”
A key trait of success in forex trading is a consistent approach.
For example, A realistic goal is to achieve a 1-2% return on your every trade.
C. Measure Success Beyond Profitability
Yes, money should be our ultimate aim in a forex trade, but not all goals should be money-centric.
For example, aim to stick to your trading plan rather than do some emotional trade to cover up losses.
D. Set a Time-frame
“A goal we cannot measure within a timeframe represents a potential loss.”
For example, you might set a time frame for the next three months, during which you will get 5% of the invested amount. Deadlines keep you accountable to measure progress.
2. Keep Learning: Make Your Foundation Strong
It would help if you evolved into new market strategies and terminologies. This will help you to a greater extent to become a successful forex trader.
A. Learn the Basics of Forex
What exactly is forex? What are the core principles of the market? Forex is one of the most decentralised financial markets in the world. It works on buying and selling the currency pairs. Learn other basic terms like pip, lots, margin, leverage and spread.
B. How Forex Works
How does the bid/ask price work? What are currency pairs, minority and exotic? The chief reasons for the fluctuation of rates in the market can depend on many factors. Like geopolitical news, central bank policies and economic indicators.
C. Study Fundamental Analysis
As a successful forex trader, learn to spot critical economic indicators. These include a country’s GDP, inflation, interest, and unemployment rates. Understand how central bank policies affect currency values. Always be aware of geopolitical events.
D. Risk Management
As a forex trader, you should know how to manage risks. You must know how to use various risk-management tools, like stop-losses. You need to be able to determine a perfect risk/reward ratio. Use leverage with care, as it can amplify profits and increase risks.
E. Build Strategies
There are different types of trading. They are swing trading, day trading, scalping, and long-term investing. Choose one based on your style, strategies, time commitment and market understanding.
3. Technical Analysis
Forex technical analysis predicts future prices. It does this by studying charts and indicators of past trends. Technical analysis holds that all factors affecting price are in the current value. It assumes price patterns repeat over time.
Also Read This: KPI Green Energy Share Price Target
Success Matrix in a Forex Trade
I have designed a success matrix for all of you traders. Follow all of these and it will ensure you good returns.
| Focused Areas | Description | Action (How to do it) |
| Risk Management | Risk is some uncertain outcome. In forex, a trader has to safeguard their investment. Many tools are available in the market, such as stop-loss. | Many traders invest in the market with risk management. It would help if you analysed risk per trade. Maintain an excellent risk-reward ratio. Do not let greed control you, and do not overleverage. |
| Emotional Control | Emotional control can hijack your senses completely. One who trades with high emotions can never achieve success. Stay away from emotions like fear and greed. | 1. Stick to your plan and follow the basics. As a trader, you must focus on implementing the strategies. 2. Take short breaks in between trades as emotions run high. |
| Long term Perspective | Don’t strive to hit a one-hit wonder. Good things always take time. Focus on constant and gradual growth. Never stop learning new things, and keep practising. | 1. Form realistic financial goals. 2. Keep control of emotions. 3. Always remember it is not a race; go slow. |
| Patience and Discipline | 1. Patience and discipline will come with experience. 2. Wait for the opportunity to strike, and then take the necessary steps. Stick to your strategies. |
1. Always stick to your plan, and never overdo things. 2. Set realistic goals. 3. Never force a trade. Do not lose focus. |
| Resilience in Losses | Please do not get overwhelmed with losses. Accept them and focus on a new trade. | 1. Learn from the losses. Analyse the losing pattern. 2. Adjust your strategy; do not let a loss discourage you. |
| Learning | Continuous learning about new policies, market trends, and global events. | 1. You must dedicate time to self-study. 2. Take webinars and online courses. 3. Engage in simulation and backtesting. |
Deep Understanding of Technical Analysis in Forex
Technical analysis in forex is an entirely independent field of study. To have a better understanding, let us dive deep into its ocean.
1. Charts
Charts are like a best friend to a forex trader. Let me explain its different forms.
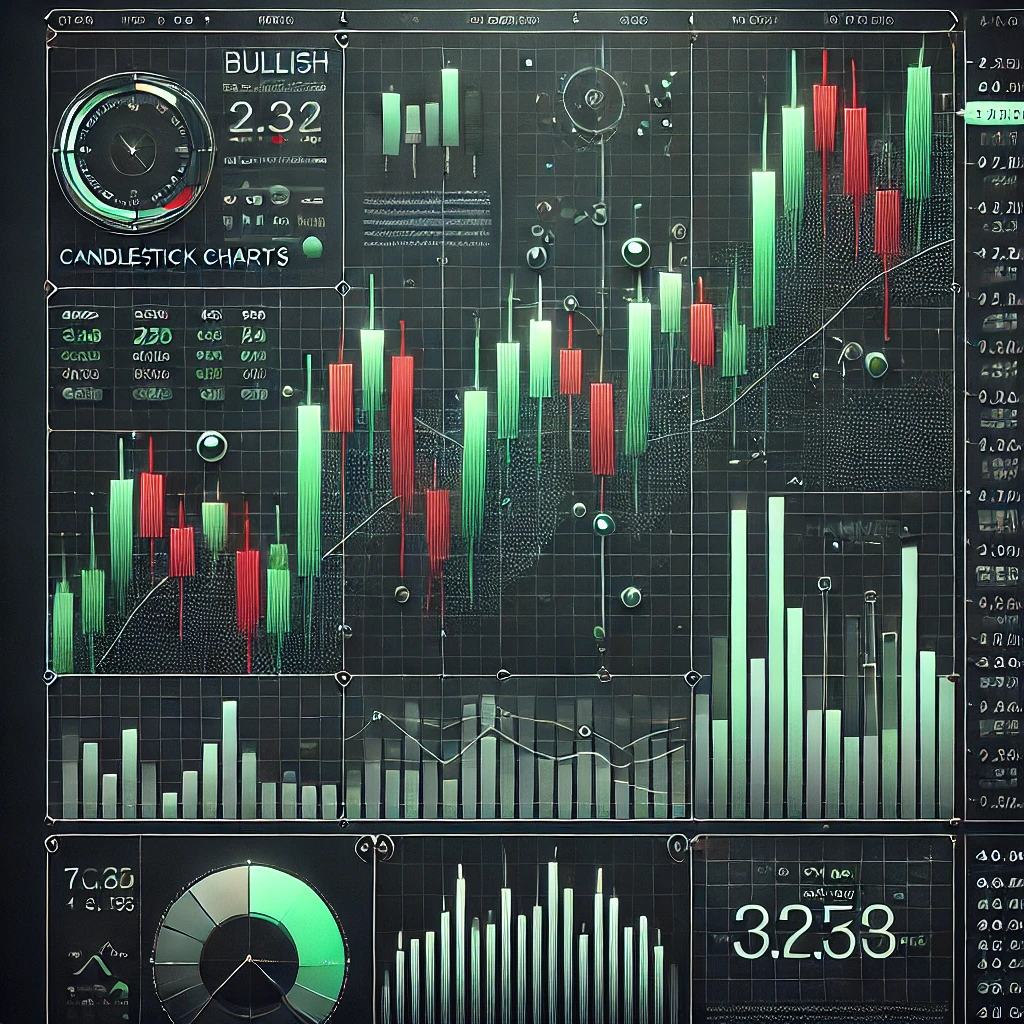
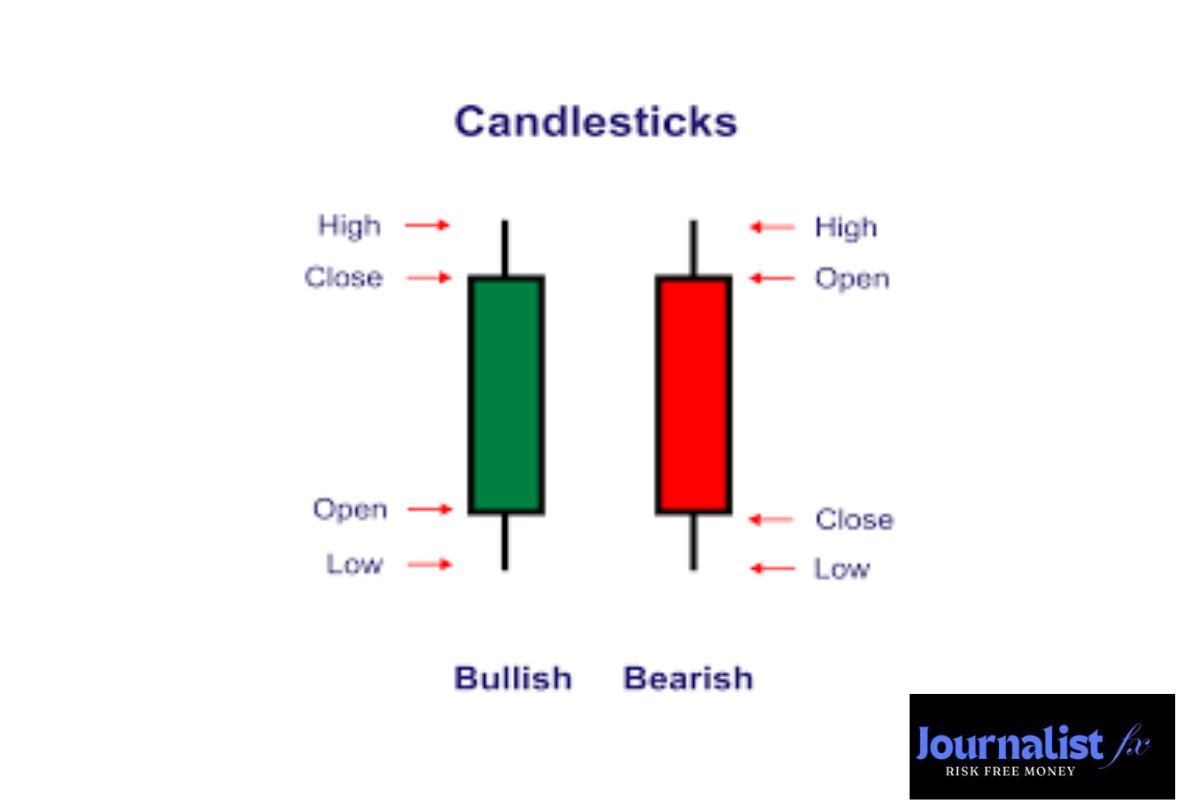
A. Candlestick Charts
A candlestick chart has four critical indicators within a time frame: open, closing, high, and low. The candle’s body colour shows if it is bullish (green) or bearish (red).
B. Line Charts
It is one of the simplest ways to track the currency price. It plots a single line from one closing to the other. This can show the rise or fall of currency prices over time.

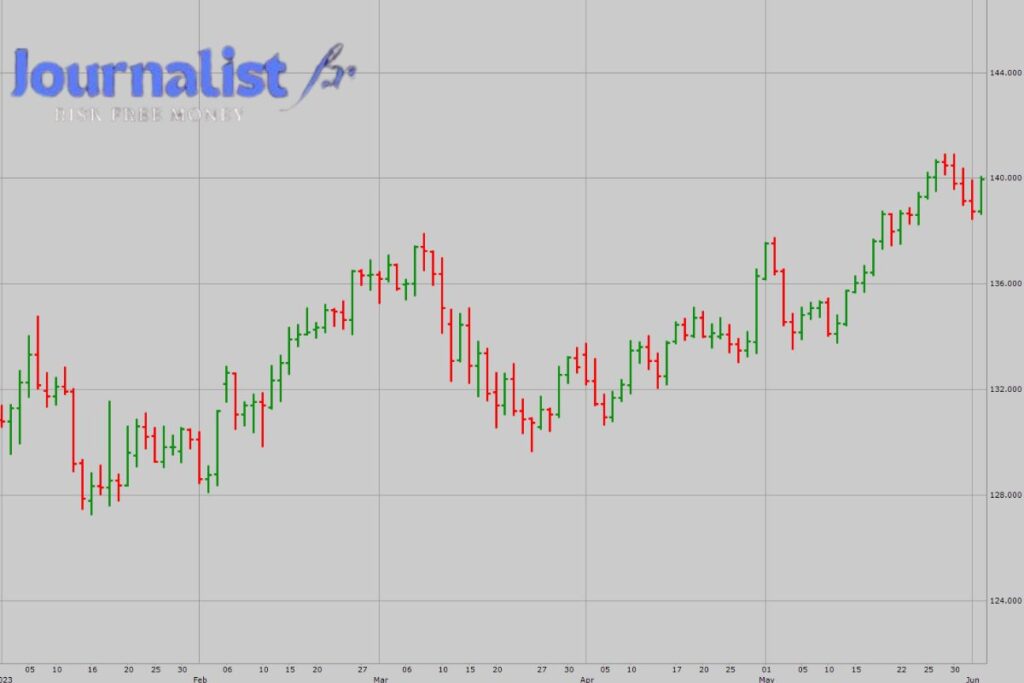
C. Bar Charts
It is a chart used to represent the currency price over time. It is a straightforward candlestick pattern represented by high, low, open and close. Each bar represents a specific period: hour, day, week or month.
2. Timeframes
Traders use these predetermined formats of time when trading occurs. Traders used multiple timeframes to get perspective on price action. These are of three different types.
A. Short Timeframe
Traders prefer them for day trading, including 1-minute, 5-minute, and 15-minute charts.
B. Medium Timeframe
Preferred for swing trading, including 1-hour and 4-hour charts.
C. Long Timeframe
Preferred for position trading, including daily and weekly charts.
3. Technical Indicators
Indicators help a trader decide what to trade by interpreting price data. They are an essential part of technical analysis. There are many technical indicators. The most common ones are:
A. Moving Average (MA)
Moving Average (MA) represents the average price over a particular time value. If the price is above the Moving Average, buyers control it. Otherwise, sellers do.
Types of Moving Average
Simple Moving Average
This calculates the average price over a specified period, for example, 50 days SMA.
Exponential Moving Average
- It tracks the price over time. Traders use it in forex trading to identify trends and predict future prices.
- Analysts use EMA as their main tool to identify trends and establish entry and exit points.
- EMA = (closing price * multiplier) + [EMA (yesterday) * (1 – multiplier)]
4. Relative Strength Index (RSI)
- It is a tool that can help forex traders. It shows when a currency is overbought or oversold.
- RSI is also used to spot entry and exit points.
- Formula of calculating RSI= 100 – [100/1 + (Average Price Gain/ Average Price Loss)]
5. Moving Average Conversion Divergence (MACD)
- It is a technical indicator. It has two lines: the signal line and the MACD line. It also has a histogram that shows the difference between them. It may help to determine the entry and exit points.
- Traders look for crossover between the signal line and MACD line. It is the probability of two cases. 1. When the MACD line crossover, the signal line is bullish. 2. The signal line is bearish when the MACD line crosses below.
6. Bollinger bands
- Traders use Bollinger bands to identify price movements.
- It comprises two outer and middle bands (usually a 20-day moving average). These outer bands represent the standard deviation above and below the middle band.
- The way to read the Bollinger band is simple: As the price moves towards the upper band, it is overbought. When the price moves towards the lower band, it is oversold.
- The band expands represents high volatility, and the contract represents low volatility.
7. Fibonacci Retracement
- It finds the critical levels of support and resistance in the market.
- Traders often calculate Fibonacci retracement after an extensive market move. The market may pause or reverse the direction before continuing the trend.
8. Price Patterns
Traders may use it to signal future price movements. There are two primary types: continuation patterns and reversal patterns.
A. Continuation Pattern
It can mean a temporary pause in the trend before a price reversal.
Triangles
- It is a technical analysis tool. It indicates a pause in the current market trend or reversal.
- There are three types of triangle patterns: symmetrical, ascending or descending.
- The triangle pattern shows that the market is unsure about the direction of the price. It also indicates a continuation of a bullish or bearish pattern.
Flags and Pennants
- This is the pattern that occurs most often in the forex market. It occurs after a sharp price movement.
- A breakout of the price usually continues the original trend from flags or pennants.
B. Reversal Pattern
A price will likely move in the opposite direction with a reversal pattern.
Head and Shoulders
It indicates a reversal in the uptrend. An inverse in the head and shoulders pattern represents a reversal in the downtrend.
Double Top and Double Bottom
- These are essential technical analysis patterns studied by forex traders.
- The double top has an ‘M’ shape, representing a bearish or negative reversal in trend.
- The double bottom has a ‘W’ shape, signalling a bullish price movement.
9. Trendline
- These are the lines drawn to show the direction of the market. It also helps to identify entry and exit points.
- An uptrend is when the lows connect in an upward-sloping manner.
- A downtrend is when the highs connect in a downward-sloping manner.
10. Support and Resistance
- These are the most essential concepts used in the forex market. Support is a price level where a currency pair finds buying interest. This can prevent prices from falling further.
- Resistance is usually the opposite of support. It is a price level where the currency pair tends to find sellers’ interest. This can prevent prices from rising further.
11. Multiple Timeframes
- Some forex traders utilize multiple timeframes to define their overall strategy.
- A trader might check the daily or weekly chart to determine the overall trend and then use a short-term chart to determine good entry and exit points.
12. Candlestick Pattern
Traders can use candlestick patterns to predict future price movement. Understanding them is the basis of a technical analysis. A few examples of candlestick patterns are:
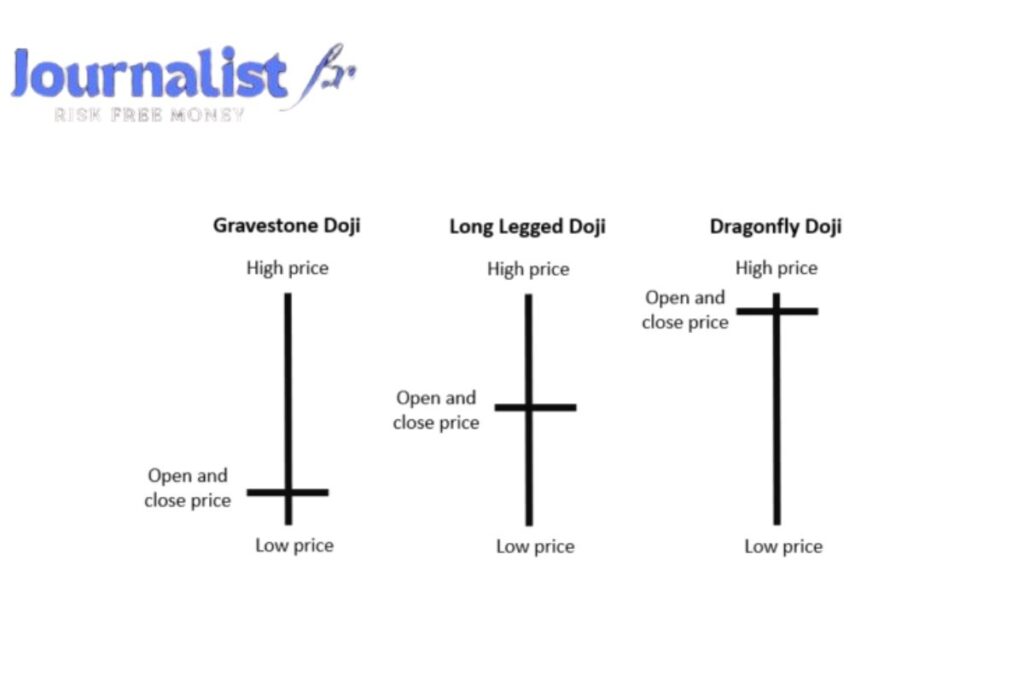
A. Doji
A doji candle generally represents indecision between buyers and sellers. It occurs when an asset’s opening and closing prices are almost similar.
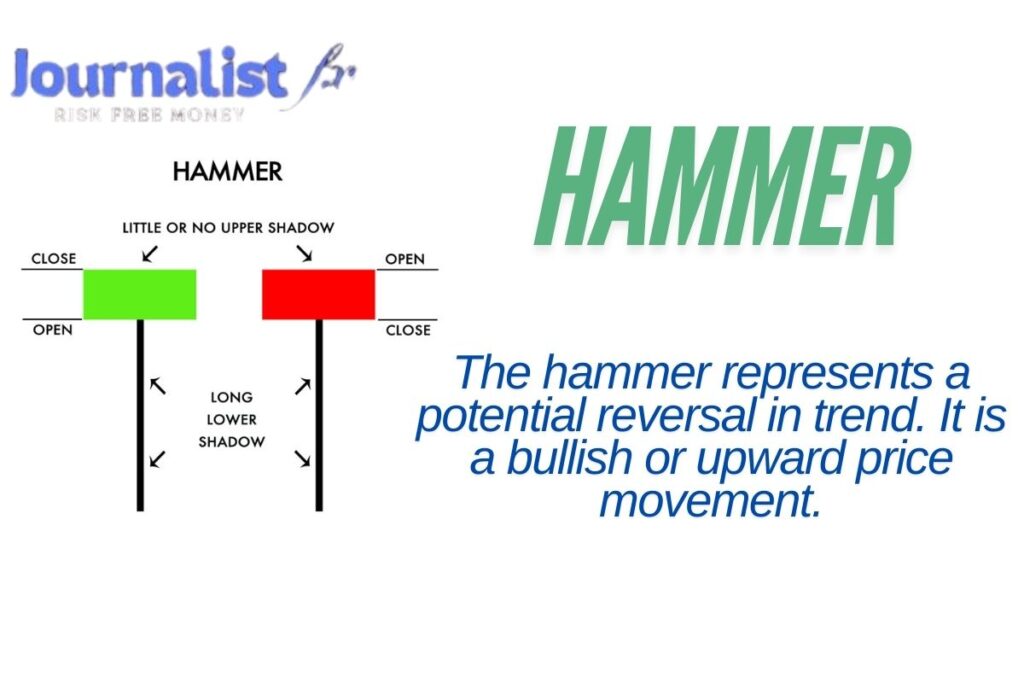
B. Hammer
The hammer represents a potential reversal in trend. It is a bullish or upward price movement.
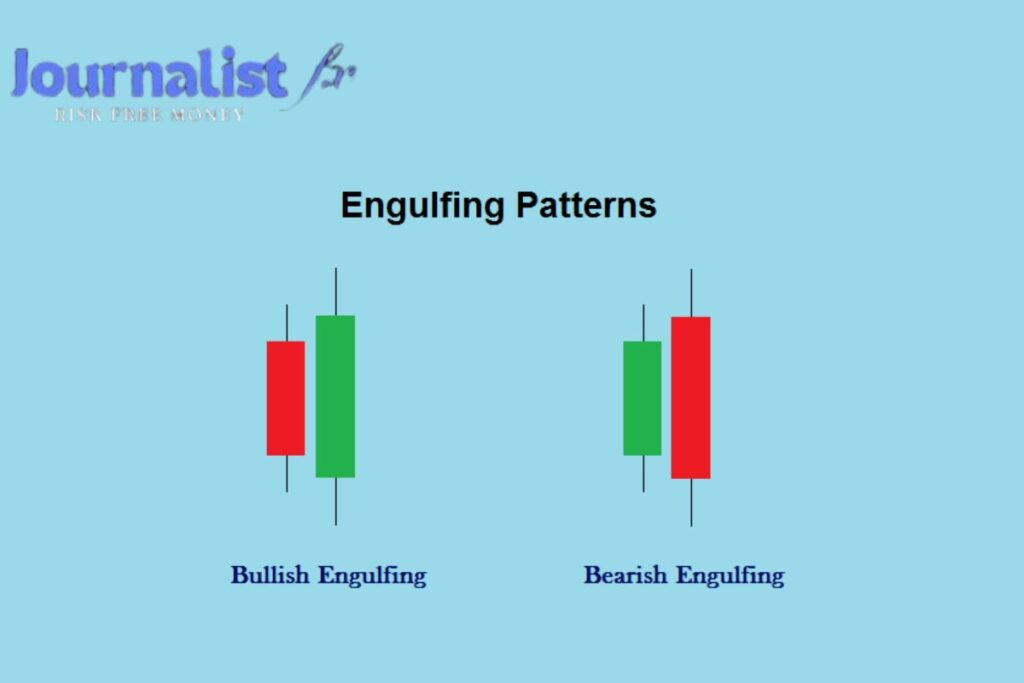
C. Engulfing
A bullish engulfing pattern is a large bullish candle. It forms after a small bearish candle. This candle generally represents market reversal. The same logic holds for the bearish engulfing pattern.
13. Backtesting and Forward Testing
- Now that you understand the technical analysis in forex, it is time to build strategies. Backtesting allows you to test your strategy on historical data. It is the best way to know how it would perform in a real-time scenario.
- Forward testing is applying strategies to live data.
- Both strategies are essential to knowing how your current plan is performing.
Conclusion
In this blog, we have discussed some market strategies for forex trading. Knowledge, strategy, and discipline will help us achieve the ultimate success in forex. We must, as suggested, learn the basics of forex. Then, we can study fundamental and technical analysis. Remember, no matter the situation, stick to your plan. I’m not saying that do not improvise, but do not change the whole plan or strategy. Other important things to manage are risk and emotional control. I am optimistic. You will become a forex trading god after you do everything in the blog.
Frequently Asked Questions
To increase the probability of winning, traders may use the 5-3-1 strategy in a forex trade. A trader executes a successful trade by aligning signals across time formats.
Let us understand this concept with an example. If the trader sees a buy signal on a 5-minute chart, it can be anything, such as a bullish candle pattern. The trader may reconfirm it by a 15-minute and 1-hour chart. People do this to obtain confirmation from these timeframes that the buying signal is correct.
This strategy is for day traders. They want to avoid scalping at short intervals, like 5-minute or 15-minute charts. Traders prefer a 1-hour chart. It has less noise than shorter timeframes. It also offers frequent opportunities.
This rule has a strong emphasis on risk management. Many view Forex trading as risky if you are not disciplined and need a risk management plan. According to the rule:
90% of forex traders lose 90% of invested value in 90 days of trade.
Yes, candlestick patterns do work in forex. Traders rely on it to make trading decisions by analysing price action. Candlestick patterns can provide visual clues for continuation and market reversal.
It is a popular tool that helps identify potential support and resistance areas. Fibonacci sequences determine these levels, and traders use them to identify potential retracement points in the trending market. Fibonacci levels in forex are 23.6%, 38.2%, 50%, 61.8%, and 78.6%