Traders see the forex market as quick money with some risk factors. That can be the prime reason many novice traders enter the market, but their lack of knowledge and skills curtails their longevity. As a responsible trader, the market always expects some discipline regarding expertise and consistency. Reading a candlestick pattern is the fundamental technical market analysis that a trader can do. On the same note, in this blog, we will discuss how to trade the engulfing candlestick market. Traders consider this pattern as one of the most reliable and actionable signals. The output of this candlestick pattern is straightforward, and it can help predict a trend reversal or continuation.
This pattern features a two-bar formation that shows a decisive shift in market sentiments. The beauty of this pattern is that it can reveal the moment when buyers or sellers overpower the opposite side. This tussle can create a lot of trading opportunities to enter a trade with favorable odds.
Real Market Scenario
Consider a real market scenario. If a bullish engulfing pattern forms near a strong support zone, it may signal the start of an uptrend. Similarly, when a bearish engulfing forms near resistance, it might indicate a potential downward movement.

What is the Engulfing Candlestick Pattern in Forex?
In forex trading, the engulfing candlestick pattern is a two-candle reversal pattern. It triggers the potential change in market direction.
1. Occurrence
It is formed when the larger candle completely engulfs the body of the previous smaller candle. The candlestick pattern is a popular tool in technical analysis. Traders use it to identify reversals.
2. Types of Engulfing Candles
- Bullish engulfing pattern
- Bearish engulfing pattern
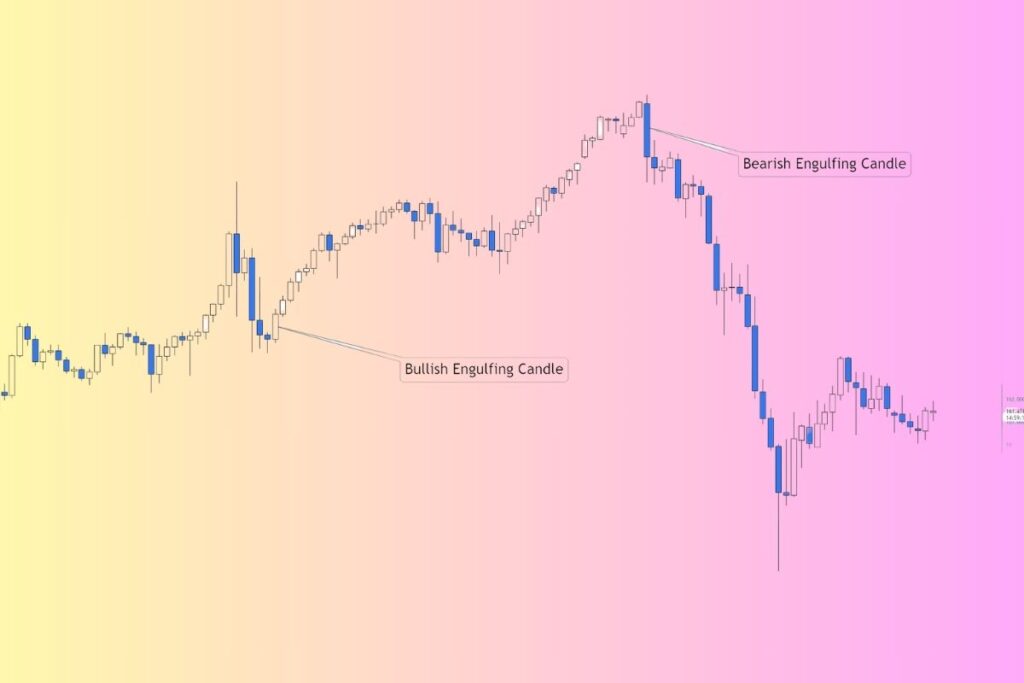
Formation of Bullish Engulfing
Appears during a downtrend.
Formation of Bearish Engulfing
Appears during an uptrend.
3. Structure
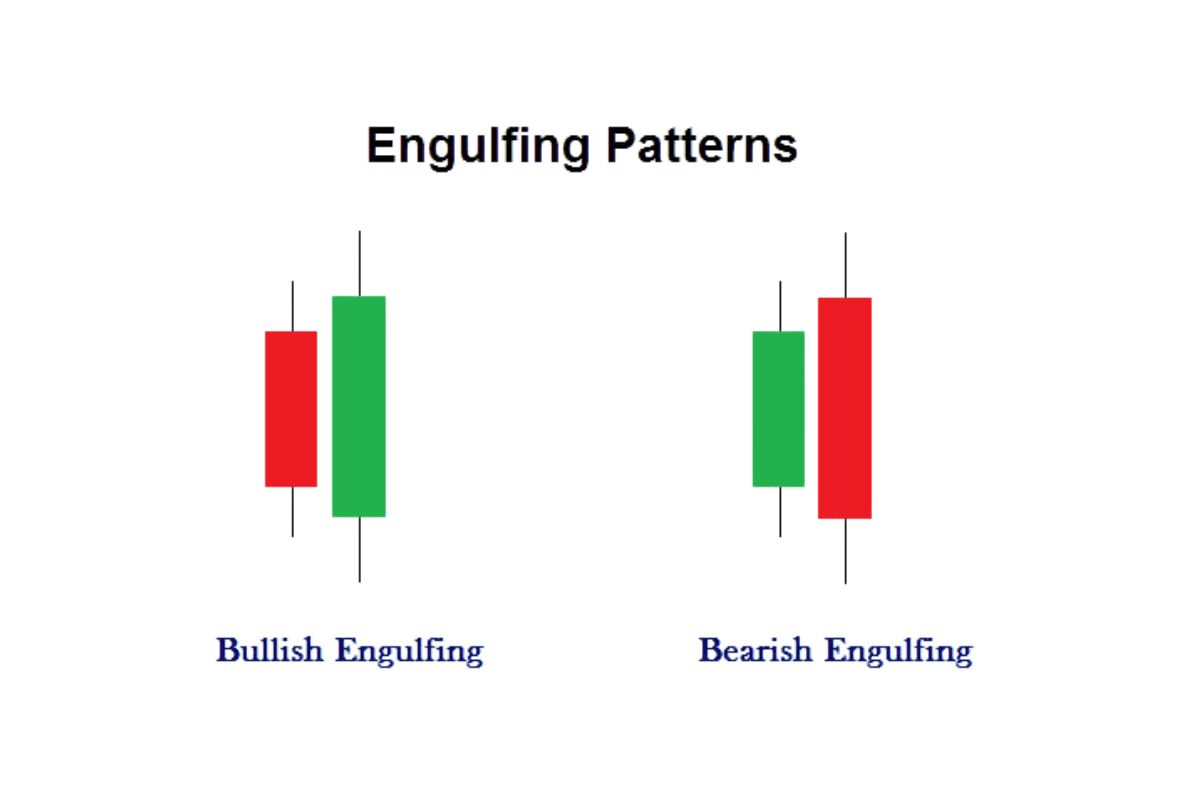
| Bullish Engulfing Candlestick Pattern | First Candle: Bearish (red/black). Which suggests high selling pressure. Second Candle: Bullish (green/white). The second candle completely engulfs the first one. |
| Bearish Engulfing Candlestick Pattern | First Candle: Bullish (green/white). Which suggests high buying interest. Second Candle: Bearish (red/black). The second candle completely engulfs the first one. |
Using Engulfing Candlestick Pattern with Other Indicators
Traders consider the engulfing pattern as reliable, but it is often used with other indicators. It is used with other indicators to enhance its effectiveness. We have made a table to simplify how it can be used with different indicators.
| Indicators | How to use | Benefits |
| Moving Averages (MAs) | 1. Traders combine both tools to confirm the trend direction. 2. For example, a bullish engulfing pattern forming above a rising 50-day MA indicates a strong uptrend. 3. The formation of a bearish engulfing pattern below a declining MA suggests a downtrend. | Using MAs with engulfing patterns smooths out price data and provides a clear trend signal. |
| RSI | Traders should use an engulfing pattern when the RSI indicates an overbought or oversold condition. Oversold: Using a bullish engulfing when RSI is below 30 (oversold) holds a higher chance of reversal. Overbought: Using a bearish engulfing when the RSI is above 70 (overbought) could signal a potential decline. The RSI indicator helps to identify momentum shifts and potential reversal points. | Traders can use Bollinger Bands to identify overextension in price movements. |
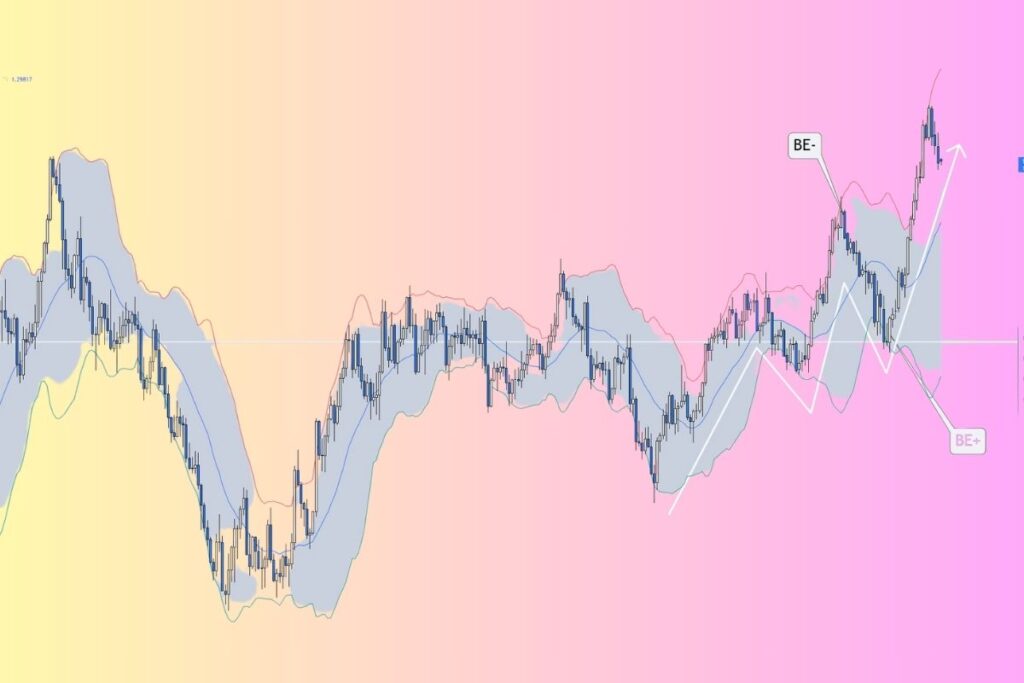
| Bollinger Bands | 1. Traders should look for engulfing patterns at the extremes of Bollinger Bands. 2. A bullish engulfing pattern near the lower band shows a rebound.A bearish engulfing pattern near the upper band shows a potential reversal. | Traders can use Bollinger Bands to identify overextension in price movements. |
| MACD | 1. Traders can align the engulfing pattern with MACD crossovers or divergences. 2. For example, a bullish engulfing occurs during a MACD bullish crossover. It enhances the signal. | Traders use MACD to reveal changes in momentum and trend signals. |
| Fibonacci Retracement Levels | 1. Traders use Fibonacci levels to identify potential support and resistance areas. 2. If an engulfing pattern appears at key Fibonacci retracement levels (for example, 38.2% or 61.8%), it will add validity to the signals. | Fibonacci levels act as psychological barriers. It may increase the reliability of the pattern. |
Tips for Engulfing Candlestick Pattern
Engulfing candlestick patterns are considered simple to read and reliable. A trader utilizing this pattern to make a trade needs to take care of other market fundamentals also. We have tried to simplify the effective use of engulfing candlestick patterns. Let us take a look.
| The Situation in the Market | Action |
| Traders should always trade in the right market context. | Bullish Engulfing: A trader should look for this pattern in a downtrend, near support levels, or during a pullback in an uptrend. Bearish Engulfing: A trader should look for this pattern in an uptrend, near resistance levels, or as a part of a retracement in a downtrend. Avoid: A trader should avoid trading in a ranging market while using an engulfing pattern as they can be less reliable. |
| Always use a confirmation signal. | Check the key levels. |
| Consider the timeframes. | Support and Resistance levels: The reliability of the engulfing pattern increases if it forms near support (for bullish) or resistance (for bearish) levels. Trendlines: Engulfing pattern near trendline bounces or breaks. Fibonacci levels: Traders should look for the pattern near Fibonacci retracement levels to confirm price reaction zones. |
| Pay attention to the size of the candle. | Large candle: A large engulfing candle shows stronger sentiment reversal. The larger the body than the preceding candle, the stronger the signal. Small or long wick candles: Traders should wait for additional confirmation. |
| Proper entry and exit strategies. | Global event or news: Traders should avoid trading engulfing patterns if any major global news breaks out or during high-volatility events. Trade in a highly liquid market for cleaner price action or fewer false signals. |
| Monitor market conditions. | Global event or news: Traders should avoid trading engulfing patterns if any major global news breaks out or during high-volatility events. Trade in a highly liquid market for cleaner price action or fewer false signals. |
| Consider the timeframes | Engulfing patterns are more reliable in higher timeframes (daily or weekly) rather than in lower timeframes (5 minutes or 15 minutes). |
Practical Example for Engulfing Candlestick Pattern
The engulfing candlestick pattern is a common tool in the forex trading market. It holds significant importance during technical analysis. Here is a practical example of using an engulfing candlestick pattern.
| Candle Pattern | Scenario | Day 1 | Engulfing Day | Interpretation | Action |
| Bullish Engulfing | Currency Pair: EUR/USD. Downtrend Market: The market is in a downtrend and showing signs of exhaustion. | View 1: A small red candle appears. Open: 1.1050 Close: 1.1030 Bearish sentiments: Indicates bearish sentiments. | Gap down opening at 1.1025. Scenario 2: Buyers push the price higher throughout the session & close at 1.1075. This will fully engulf the body of the previous day’s bearish candle. | Sell trade: After the pattern confirmation, enter into the trade, keeping a stop-loss above the high of the engulfing candle at 135.60. Target Profit: Nearby support levels such as 134.20. | Buy trade: After the pattern confirmation, enter into the trade, keeping a stop-loss below the low of the engulfing candle at 1.1020. Target Profit: At a nearby resistance level such as 1.1120. |
| Bearish Engulfing | Currency Pair: USD/JPY. Uptrend Market: The market is in an uptrend, nearing a resistance level. | View 1: A small green candle appears. Open: 135.00 Close: 135.30 Buying Interest: Shows buying interest but with reduced momentum. | Buy trade: After the pattern confirmation, enter into the trade, keeping a stop-loss below the low of the engulfing candle at 1.1020. Target Profit: At a nearby resistance level such as 1.1120. | It indicates a potential reversal from the bullish run to the bearish sentiments. | Gap up opening at 135.50. Scenario 2: Sellers dominate the session, and the price closes at 134.80. This will fully engulf the body of the previous day’s bullish candle. |
Conclusion
In this blog, we have discussed how to trade the engulfing candlestick pattern. It is a powerful tool used by forex traders worldwide. It will give insight into trend reversal or continuation. Identifying this pattern is quite simple and can bring profitability in a trade. Traders use this pattern with other indicators. It can help make informed decisions and improve trading strategies.