In the forex trading world, the timely execution of a trade is most important. It will decide the profitability of that trade. For timely entry into the trade, traders across the globe utilize various tools. These tools will help them to make an informed decision, and candlestick patterns are among the preferred tools. Traders use candlestick patterns to get an idea about price action and the sentiments of buyers and sellers in the market. This blog will discuss the bullish candlestick pattern used in the forex market. These candlestick patterns are valuable for traders looking to capitalize on upward price movement.
A bullish pattern signifies buyers taking control of the price after reversing a downtrend or strengthening an uptrend. There are distinctive bullish patterns that tell a story about the market sentiment. Traders buy or sell based on these patterns. For example, a hammer pattern means buyers take control of price movement after sellers push it down. Three white soldiers have a bullish candlestick pattern that predicts the reversal of the potential downtrend. There are many more patterns to explore. Stay with us.
What is a Candlestick Pattern?
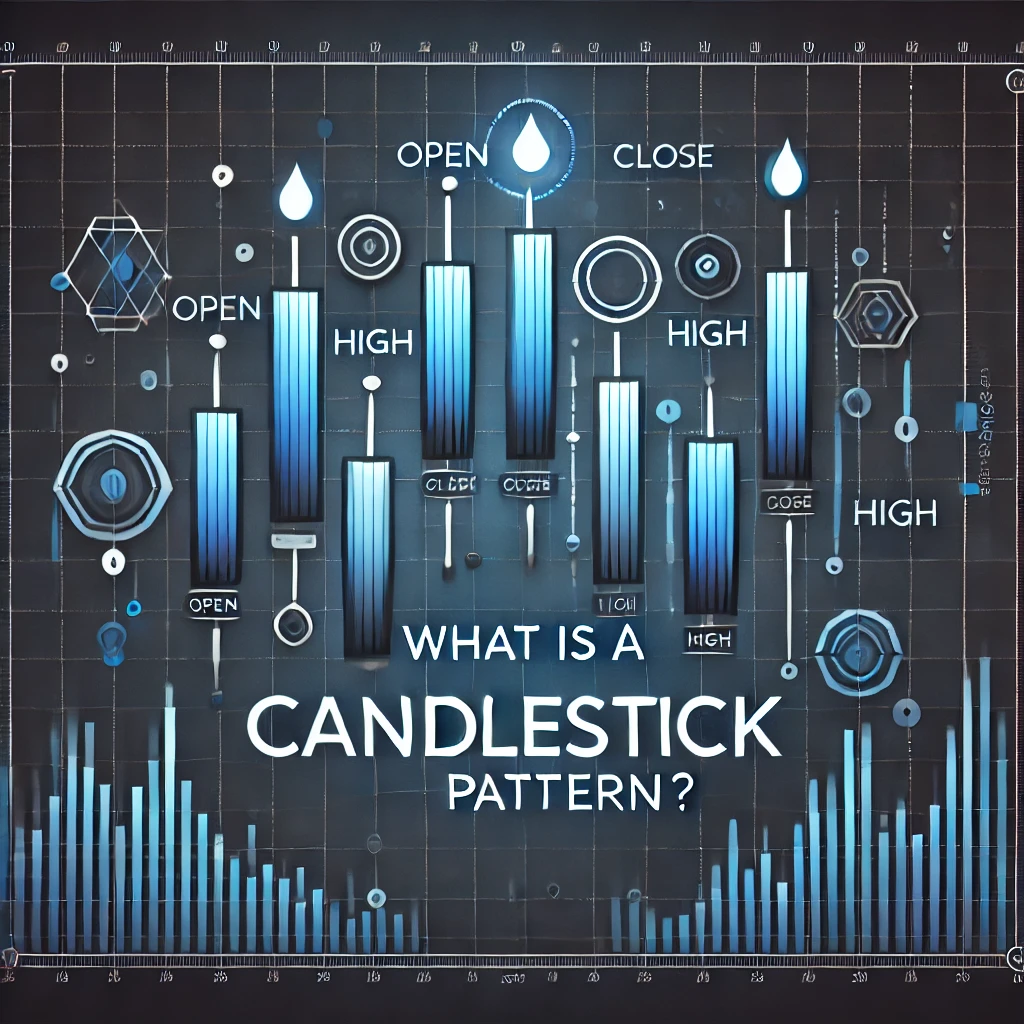
Learning candlestick patterns is a fundamental point of technical analysis. It is a chart pattern to understand market trends and potential price movements. It will be based on historical data. Each candle of the candlestick pattern represents price movement over a timeframe. It can be 1 minute, 1 hour, or 1 day, etc. Each candle provides information about that period’s open, close, high, and low prices.
Components of a Candlestick
There are two major components of a candle.
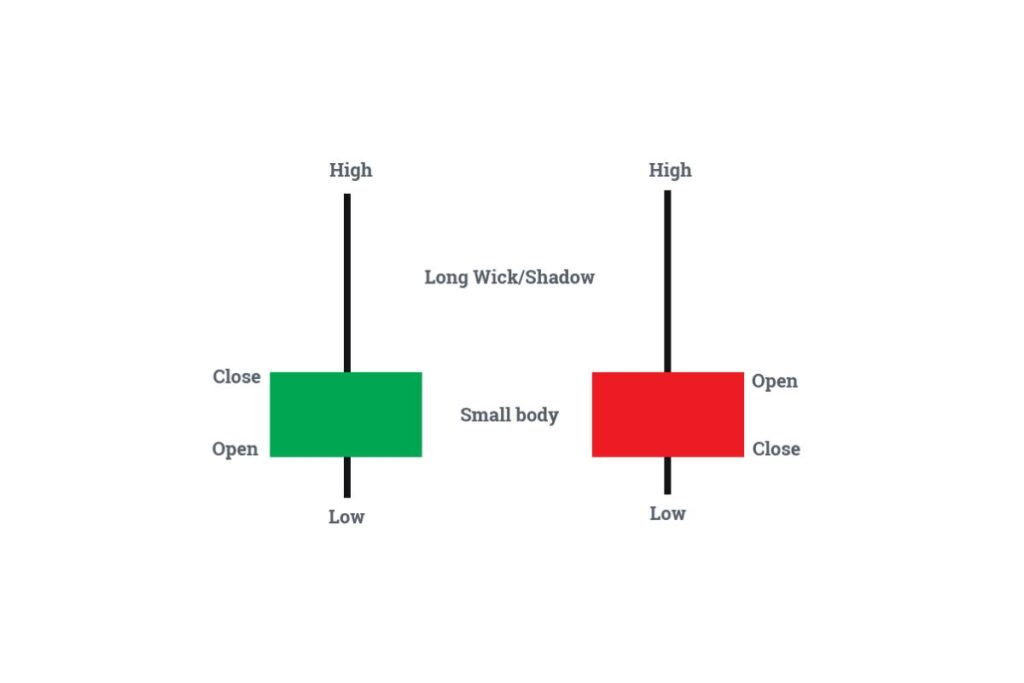
Body
It is the area between the open and closed points of a candle. A body can be further classified as a green (or white) or red (or black) candle.
- A green (or white) candle represents a bullish market condition. The closing price of that candle is higher than the opening price.
- A red (or black) candle represents a bearish market condition. The closing price of that candle is lower than the opening price.
Wick
Traders also refer to it as a shadow. A thin line above and below the body shows the highest and lowest prices during a time frame.
- The upper wick represents the highest price.
- The lower wick represents the lowest price.
Candlestick patterns can help a trader identify the market’s major support and resistance levels. Some patterns indicate buying opportunities, while others represent market indecision or a continuation pattern.
Bullish Candlesticks used in Forex
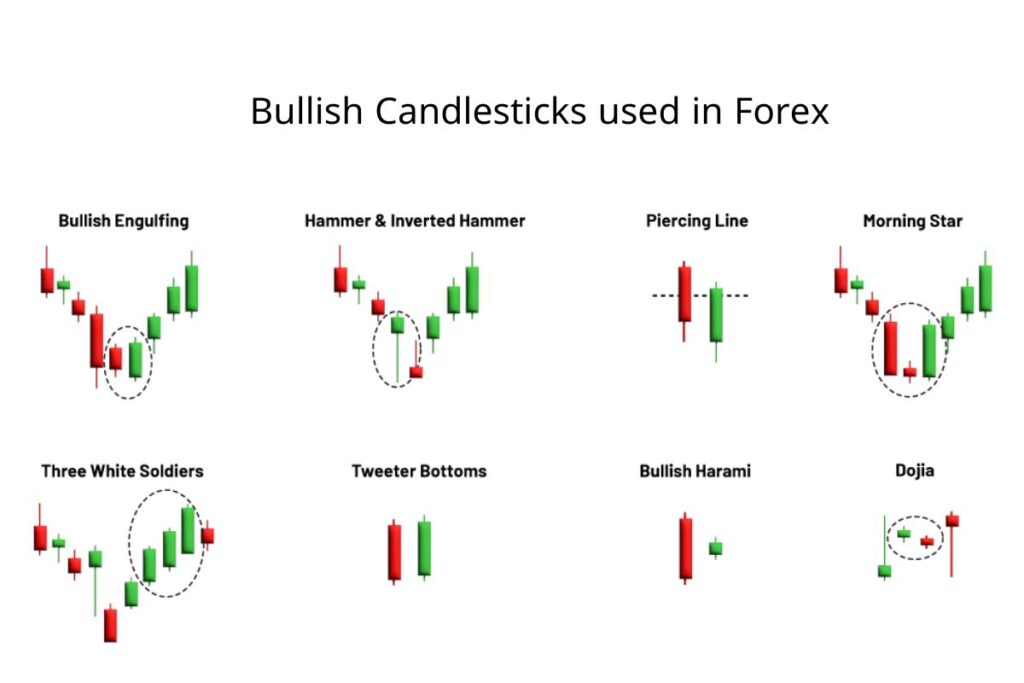
Forex is the most volatile and liquid financial market in the world. Forex trading uses several bullish candlestick patterns. They determine a potential reversal or continuation of an uptrend. Let us take a look at different bullish candlestick patterns used in forex.
1. Bullish Engulfing
This is a two-candlestick pattern. In this pattern, a large green (or white) candle completely engulfs the previous smaller red candles.
Significance of Bullish Engulfing
This formation refers to a strong reversal to the upside. The buying trend overpowers the previous selling trend.
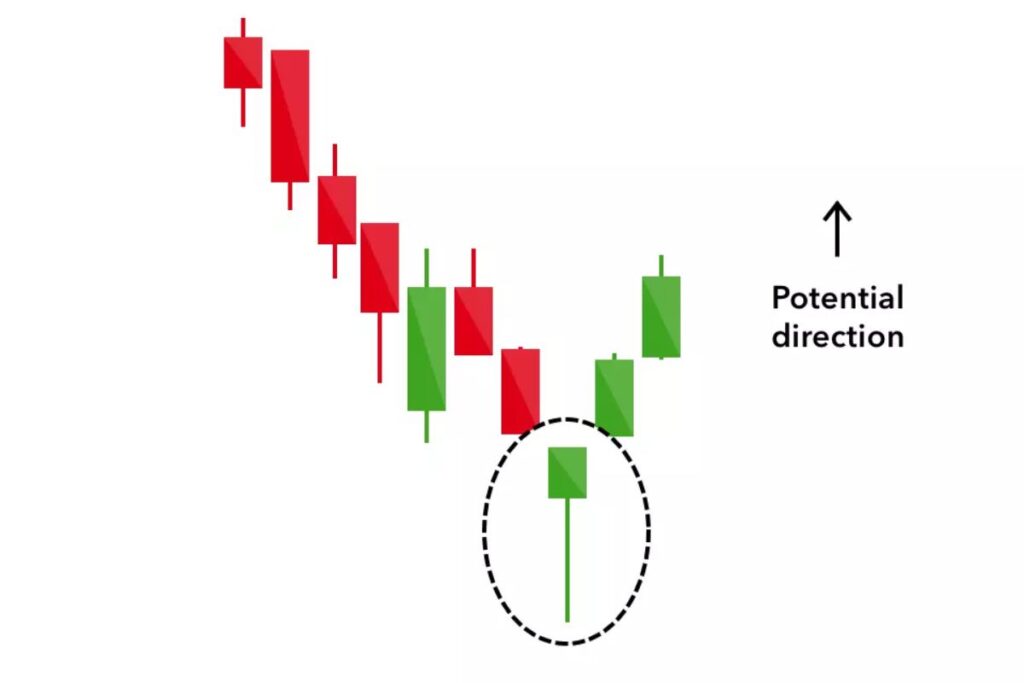
2. Hammer
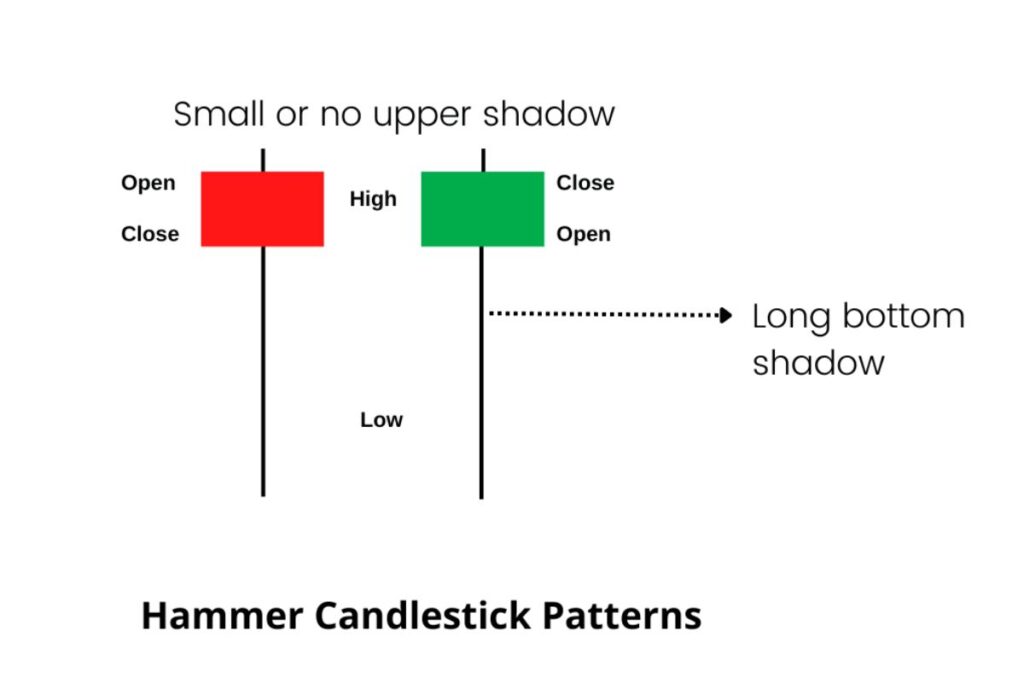
A hammer pattern appears at the bottom of a downtrend. The candle has a short body with a long lower shadow.
Requirement
The lower shadow must be twice the length of the body.
Significance of Hammer
A hammer signifies a reversal to an uptrend. It happens when the buyers in the market weaken the selling pressure.
Color of the Body
A green hammer signifies a stronger uptrend than a red hammer.
3. Piercing Line
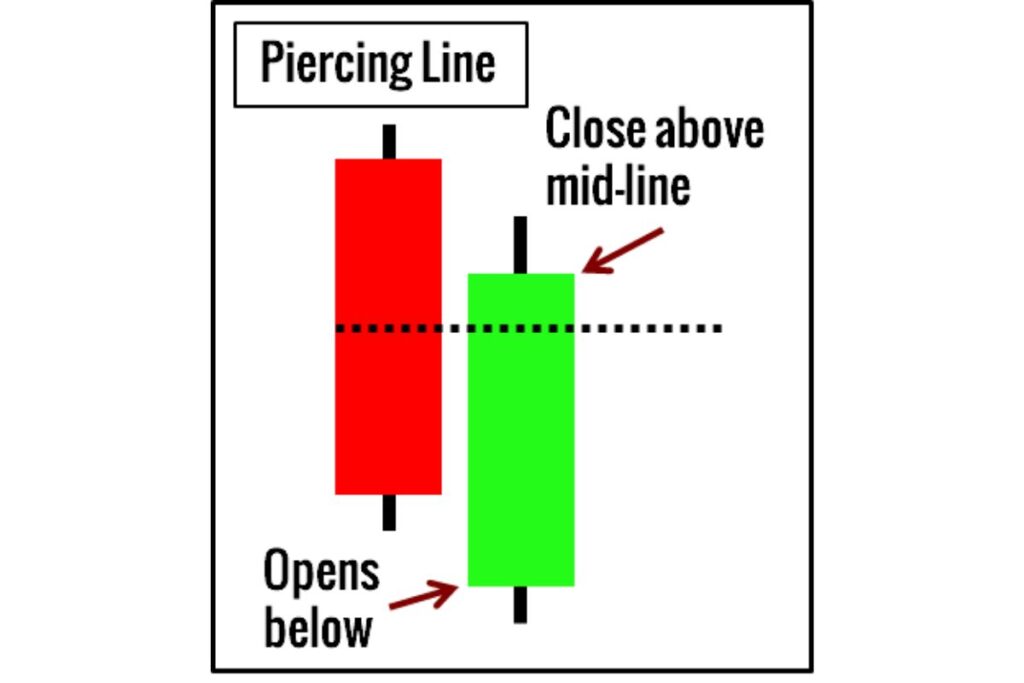
This is a two-candlestick pattern. The green candles open below the close of the red candle and close above the red midpoint.
Significance of Piercing Star
The candle pattern suggests that the buyers are taking control of the market from the sellers. This triggers a trend reversal from bearish to bullish.
4. Morning Star
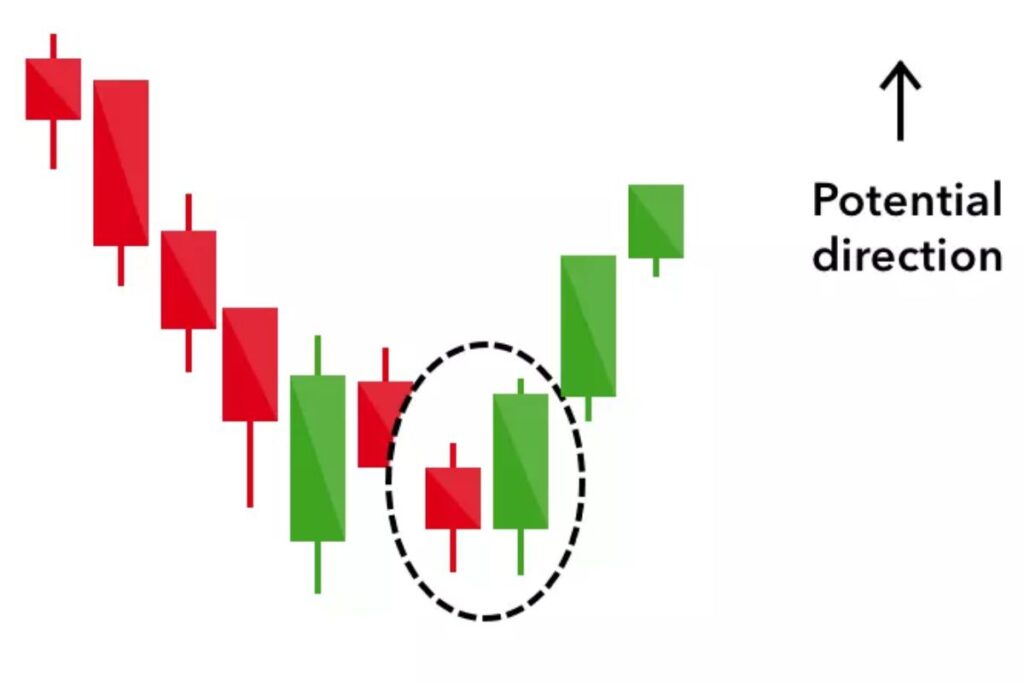
- The morning star is a sign of hope in a downtrend market. It is a three-candlestick pattern.
- It consists of one short-bodied candle between a long red candle and a long green candle.
Significance of the Morning Star
It is a powerful reversal pattern. The buyers enter into strong positions to take control of the market from the sellers.
5. Three White Soldiers
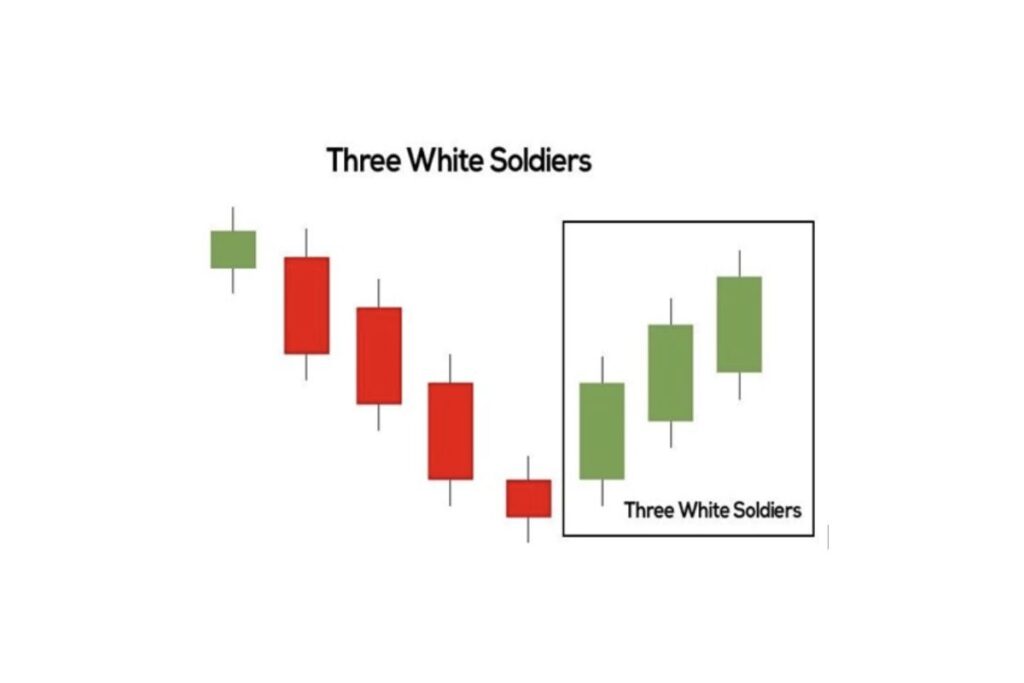
- Three white soldiers represent a bullish reversal pattern, a price reversal from a bearish to a bullish market.
- The pattern forms a staircase-like structure as the price increases. In simpler terms, it consists of three consecutive green candles. Each of them closes higher than the last.
Significance of the Three White Soldiers
It signifies a strong reversal to an uptrend from a downtrend market.
6. Bullish Harami
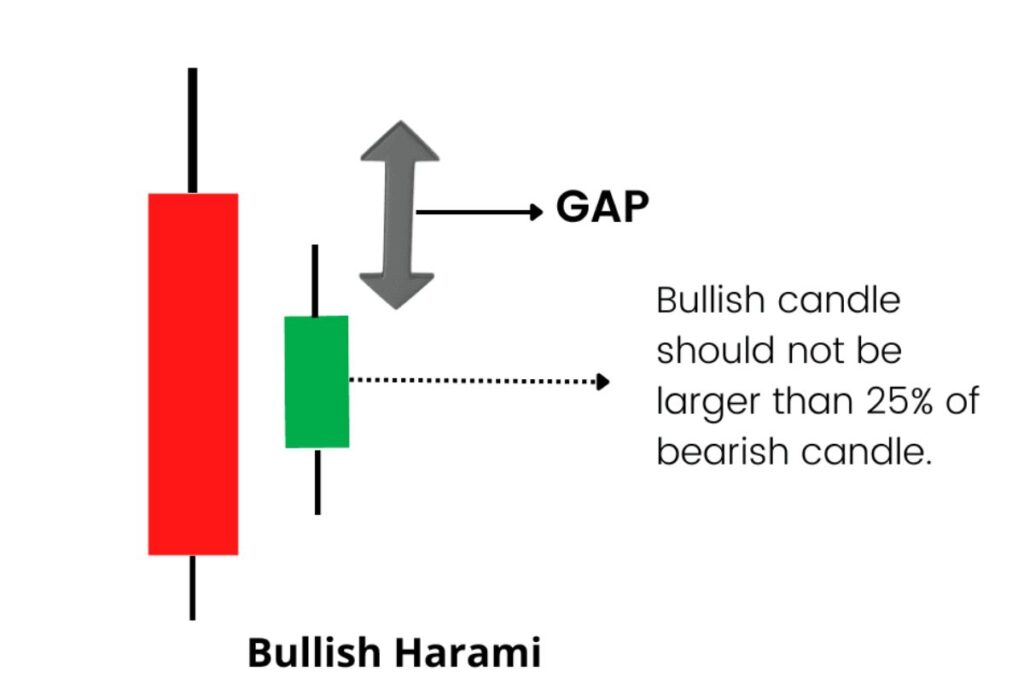
Bullish harami is a two-candlestick pattern. A small green candle appears within a preceding large red candle.
Significance of Bullish Harami
This candlestick pattern suggests that the bearish trend is weakening and ending. This also signifies the beginning of a bullish trend.
7. Inverted Hammer
The inverted hammer is a single candlestick pattern that appears after a downtrend. It has a small body and a longer upper wick.
Point to Remember
The inverted hammer is less strong than a regular hammer. It can suggest a reversal.
Significance of Inverted Hammer
It signifies a buying interest after a downtrend. A strong selling trend means a potential downtrend, and a strong buying trend means a potential uptrend.
8. Doji Star Bullish Reversal
A Doji candlestick pattern has the opening and closing prices at almost the same level.
A doji star bullish reversal candlestick pattern is a three-candlestick pattern where a doji follows a red candle and then a green candle.
Significance of Doji Star Bullish Reversal
The candlestick pattern shows a level of indecision in the market. The pattern is reversed to an uptrend when the green candle forms, suggesting buying interest.
9. Tweezer Bottom
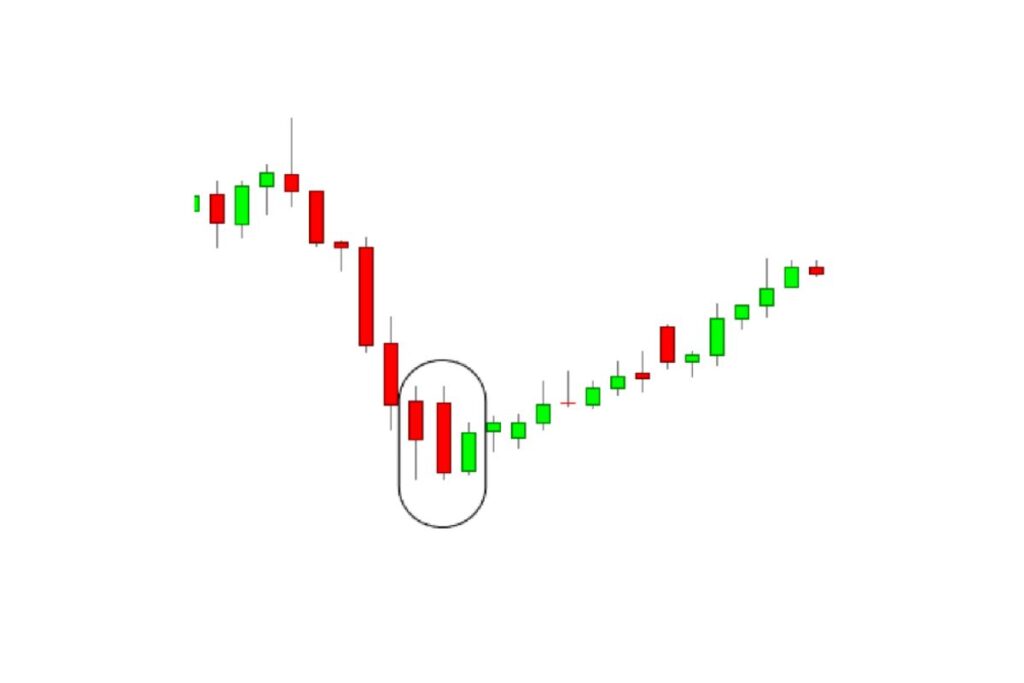
It is a two-candlestick pattern. Both the candles show similar lows. The first candle is red, extending a downtrend, while the second candle is green, signalling a potential reversal to the upside.
Significance of Tweezer Bottom
The formation of this candlestick pattern suggests that the downtrend has hit a bottom. From this point, a reversal to the uptrend is possible as buyers start entering the trade.
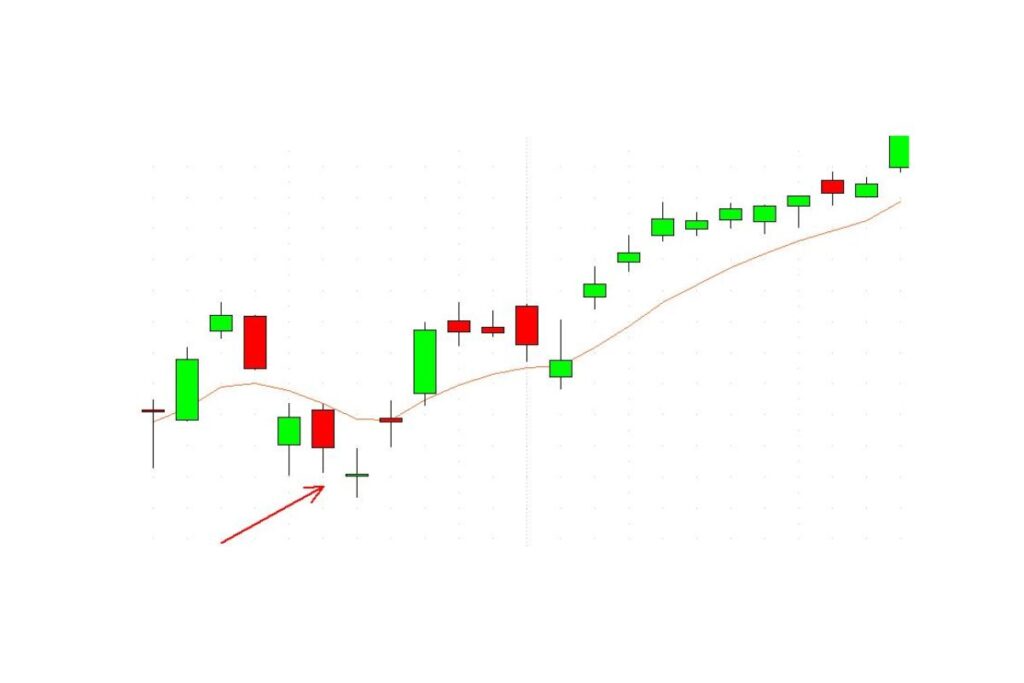
10. Dragonfly Doji
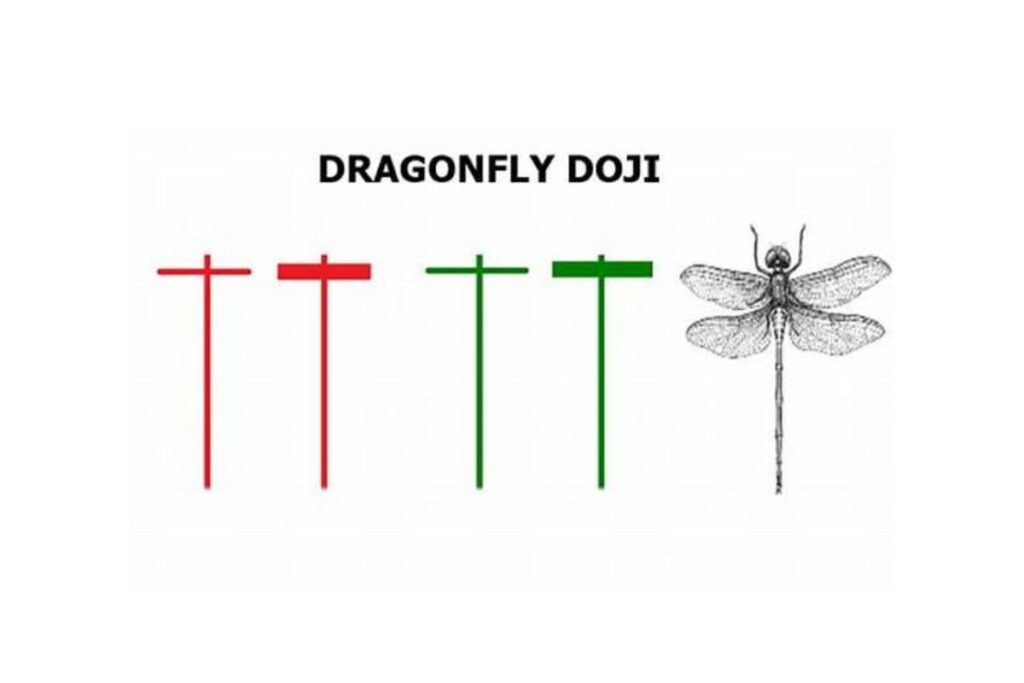
This candlestick pattern has open, high, and close prices near each other, with a longer lower wick (or shadow).
Significance of Dragonfly Doji
When a dragonfly doji appears after a downtrend, a reversal is possible. This can happen as buying pressure is more than selling pressure.
11. Marubozu (Green, or White)
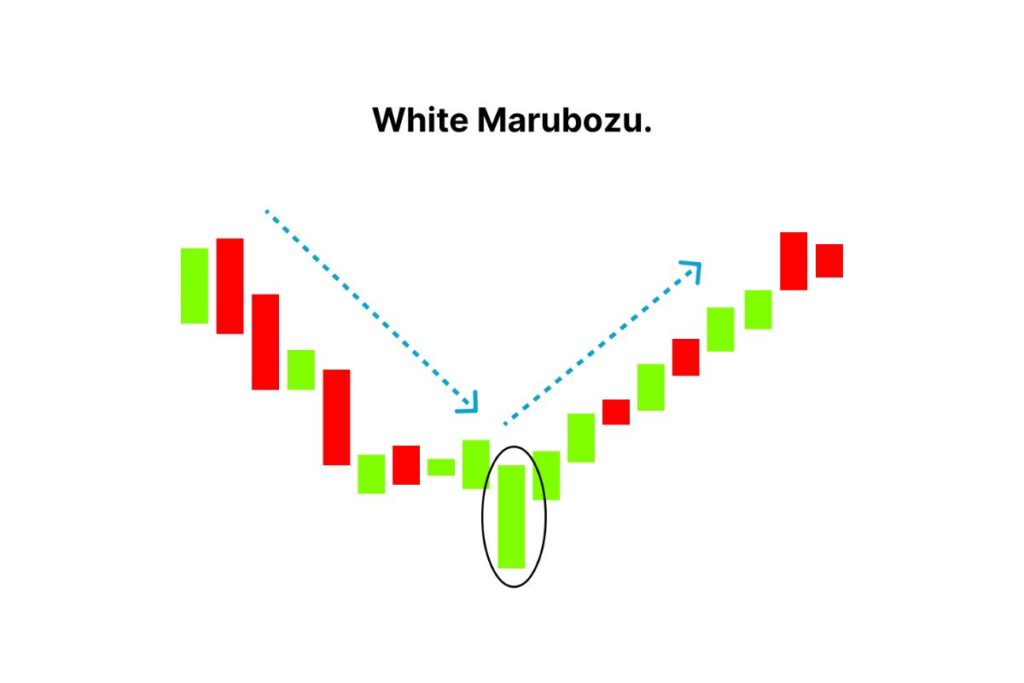
It is a single candlestick pattern. Marubozu is a full-bodied green candle with no or low wicks or shadows.
Significance of Marubozu (Green or White)
It indicates strong bullish momentum, a continuation signal of an uptrend. If this candle forms after a downtrend, it represents a reversal.
Difference in Interpretation of Candles
The candlestick interpretation is the same for forex and other trading markets like commodities and stocks. There are certain market factors that can create differentiation in the interpretation of candles. Let us see those factors.
| Factors | Forex | Stocks/Commodities |
| Trading Hours | The Forex market operates 24/5, with Forex trading sessions overlapping. The continuity in forex means the candlesticks are formed without a significant price gap. This makes candlestick pattern analysis reliable and more fluid for real-time analysis. | All stock or commodities markets have fixed trading hours. There is a high chance of a gap opening due to after-hours news or pre-market trading. Due to these gaps, the interpretation of candle patterns like Morning Star and Bullish Engulfing changes. |
| Liquidity | The major currency pairs like EUR/USD and USD/JPY are highly liquid. Due to high liquidity, the price action is smooth, creating clear candlestick patterns. These types of candlestick patterns are more reliable. | The liquidity in stock and commodity markets varies, especially for small-cap stocks. In cases of low liquidity, candlestick patterns are less reliable. |
| Volatility | acroeconomic factors can cause rapid price movements in forex trading. Patterns such as a Doji or a Hammer will appear with regularity. Thus, they have low reliability, and traders require additional confirmation. | These markets are less volatile than others. However, they can gain volatility due to earnings reports, supply-demand shifts, and other company news. Candlestick patterns in these cases may be more reflective of long-term sentiment shifts. |
| Trends and Time Frames | In the forex market, any geopolitical event can set a trend, and these trends persist for a long time. Traders trade on shorter time frames to capitalize on smaller price movements. Shorter time frames are like the 1-minute chart to the 4-hour chart. Candlestick patterns like Three White Soldiers signify a short-term reversal rather than a long-term trend shift. | In these markets, long-term factors create trends. Long-term factors can be seasonal demand for commodities and quarterly earnings for stocks. Daily or weekly candlestick patterns are essential for trend analysis. |
Pro tip
- Forex traders combine candlestick patterns with other indicators. These are Moving Averages (MA), Fibonacci levels, or RSI to confirm orders.
- For example, a Hammer pattern near a support zone on EUR/USD is more reliable when the RSI shows an oversold condition.
Tips for Forex Traders Using Bullish Candlestick Patterns
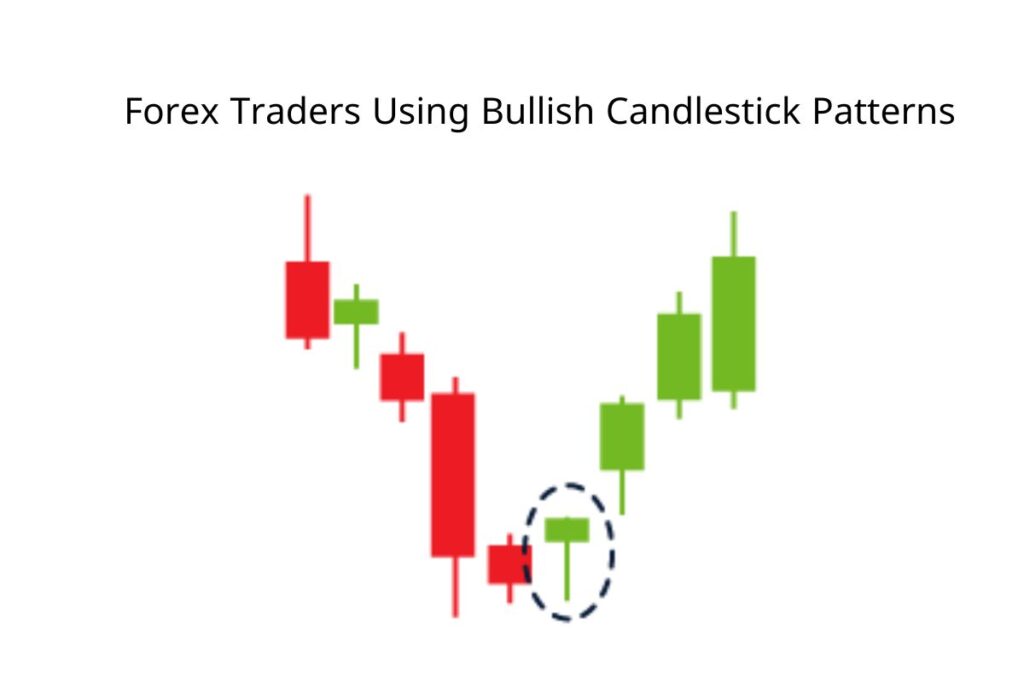
In some ways, Forex trading differs from other trading, like stocks and commodities. Trading hours and other market fundamentals are essential in this slight difference. Let’s look at some tips for forex traders using bullish candlestick patterns.
1. Look for Patterns with Key Support Levels
- For the effective use of candlestick patterns, look for bullish patterns near support levels or at the end of a downtrend.
- A bullish candlestick pattern of a Hammer or Bullish Engulfing near such levels increases the likelihood of a successful trade.
2. Combine Candle Patterns with Other Indicators
Combine the candlestick pattern with other indicators for confirmation and a good trade.
Moving Averages: A moving star candlestick pattern near the 50-day or 200-day moving average confirms reversal.
RSI: A bullish pattern near an oversold RSI (below 30) indicates a strong reversal.
Fibonacci Retracement: A bullish pattern near the Fibonacci level of 61.8% enhances its reliability for uptrend continuation.
3. Candle size Matters!
- A robust and bullish candle is represented by its size relative to recent candles.
- Look for bullish, solid candles; they signal strong buyer activity. Buying in this condition is more reliable.
- Weak candles can increase uncertainty in a trade. So, avoid them.
4. Wait for Confirmation
- It is very important in forex trading to wait for confirmation. This waiting period can increase the probability of a profitable trade.
- After identifying a bullish candle, wait for the next candle. This will confirm the reversal or continuation.
Conclusion
In this blog, we have discussed the bullish candlestick patterns in Forex. The meaning of each bullish candlestick pattern used in the forex trade is similar to other trades. These can be stocks and commodities trades. Due to differences in the market structure and other factors, the interpretation of these candles can be different. Combining them with other technical indicators like MA and RSI can be more beneficial for traders.