In the fast-paced world of forex trading, a trader might require many saving graces to stay happy by the end of the day. Let us start with pure basics, and recognizing a candlestick pattern is vital for making an informed trading decision. In this blog, we will discuss one invaluable pattern called the Evening Star Candlestick Pattern. You might wonder how to trade with it in a way that maximizes success in the chaotic forex trading environment. Stay tuned with us; we will unveil everything.
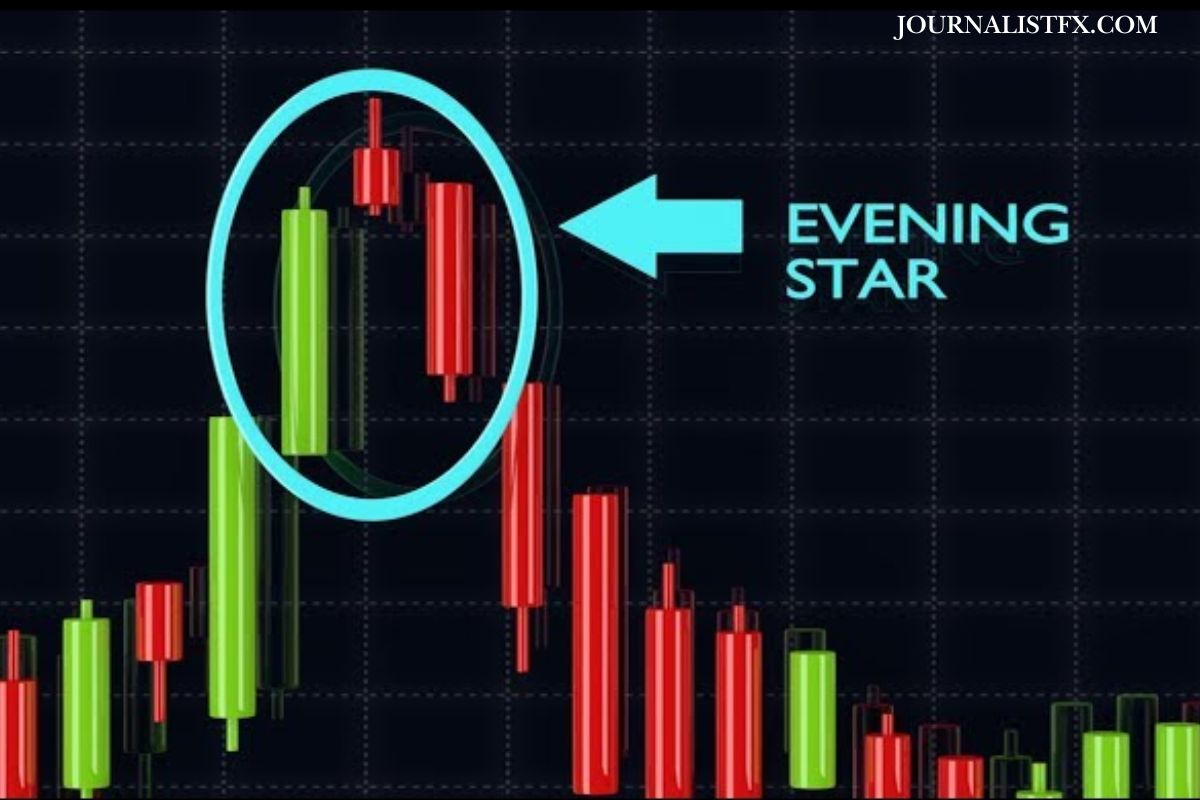
Let me brief you on something about the candle. It consists of three candlesticks and forms at the peak of an uptrend. The appearance of this candlestick means something to the traders. It signifies the transition from a bullish to a bearish trend.
Pro tip? The evening star formation helped traders identify the precise movement from where they could exit a trade. This action can secure profits or minimize losses for traders.
Appearance of The Pattern
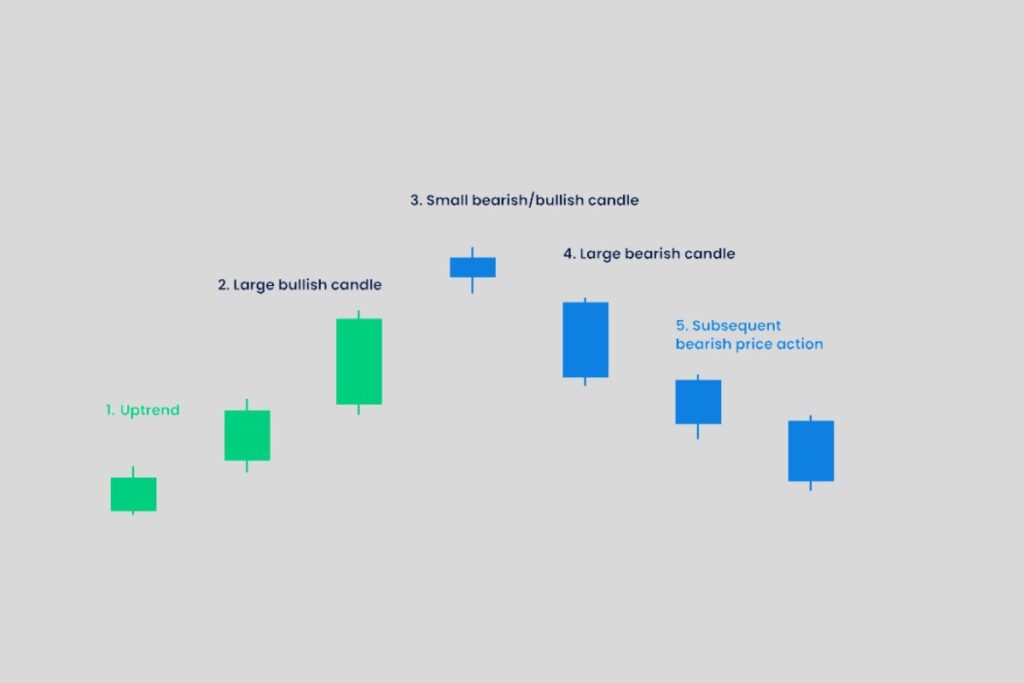
- The evening star candlestick pattern starts with a large bullish candle, which signifies a strong bullish or upward momentum.
- A small bullish candle follows this pattern, which is the first sign of hesitation in the market; traders are getting dicey.
- The final candle is large and bearish, suggesting the market is entering a downtrend. This candle opens below the previous candle’s closing price and acts as a confirmation of a downtrend.
Note: Traders use the Evening Star Candlestick Pattern to mark their exit from a trade. This pattern often forms on the price chart, making it a reliable tool. This pattern can also act as a good risk management tool.
What is an Evening Star Pattern
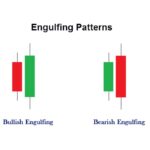
- The evening star is a three-candlestick pattern. It is a bearish reversal signal.
- As mentioned, the pattern consists of three candlesticks that emerge at an uptrend’s peak. In this formation, each candlestick represents a distinct market sentiment.
- The first candle in the pattern represents strong buying pressure; therefore, it finishes with a strong bullish candle. Another bullish candle follows this, but the formation is less strong than the first one. This candle represents a deceleration in the upward push. Finally, the third candle is a large bearish candle. It opens below the closing price of the second candle. The formation of this candle confirms a shift from bullish to bearish sentiment.
- The sharp contrast between strong bullish and bearish candles highlights pattern reliability as a signal of a potential downtrend.
- The formation of this pattern allows traders to exit long positions and enter short positions. Utilizing this trading sense and other indicators can increase a trader’s profitability.
Special Consideration for Evening Star Candlestick
The evening star candlestick is a pattern that can help traders to timely exit from a long trade or enter into a short trade. There are special considerations while reading the candle pattern, and we will explain them one by one.
| Considerations | Explanation |
| In the context of the trend | 1. Traders consider the formation of the evening star pattern reliable if it appears after a sustained uptrend. 2. Traders can confirm the trend by conforming to the prior trend’s strength. A weaker uptrend might reduce pattern significance. |
| Analysing Volume | 1. Traders can check the credibility of the pattern by checking the volume of the third candlestick. The volume should be high for the third bearish candle. 2. Traders can confirm the hesitation in the market if the volume is declining around the second bullish candle. It shows the buyers’ limit is getting exhausted. |
| Gap analysis | 1. The gap between the first and second candles and between the second and third candles enhances the pattern’s strength. 2. If there is a lack of gaps, the reliability of the pattern can be questioned. |
| Third candlestick confirmation | 1. The third bearish candlestick must close well below the middle of the first bullish candlestick. If this happens, then it is a strong reversal signal. 2. There can be a case if the third candlestick close is a wick (not far into the first candle’s body) or doesn’t cross its midpoint, suggesting that the bearish momentum is not strong. Traders should avoid trading in this case. |
| Market conditions | 1. Beware: Traders must not consider the evening star in a range-bound or highly volatile market. It can generate false signals. 2. It is more effective in the trending market. |
| Additional indicators | 1. Traders combine evening stars with indicators like RSI, moving averages, and support/resistance levels to confirm the reversal. 2. To get more confirmation on a trend reversal, traders use the divergence in indicators like RSI and MACD. |
| Follow through action | To make it a perfect trade. The traders should wait for additional confirmation, for example, the continuation of a bearish candle, before making a trade. |
Three Examples of Evening Star Candlestick Patterns
The evening star candlestick pattern is a reliable bearish reversal indicator. Traders around the world use it in day-to-day trading. Let us see some live examples of it.
1. Daily Chart Example on EUR/USD
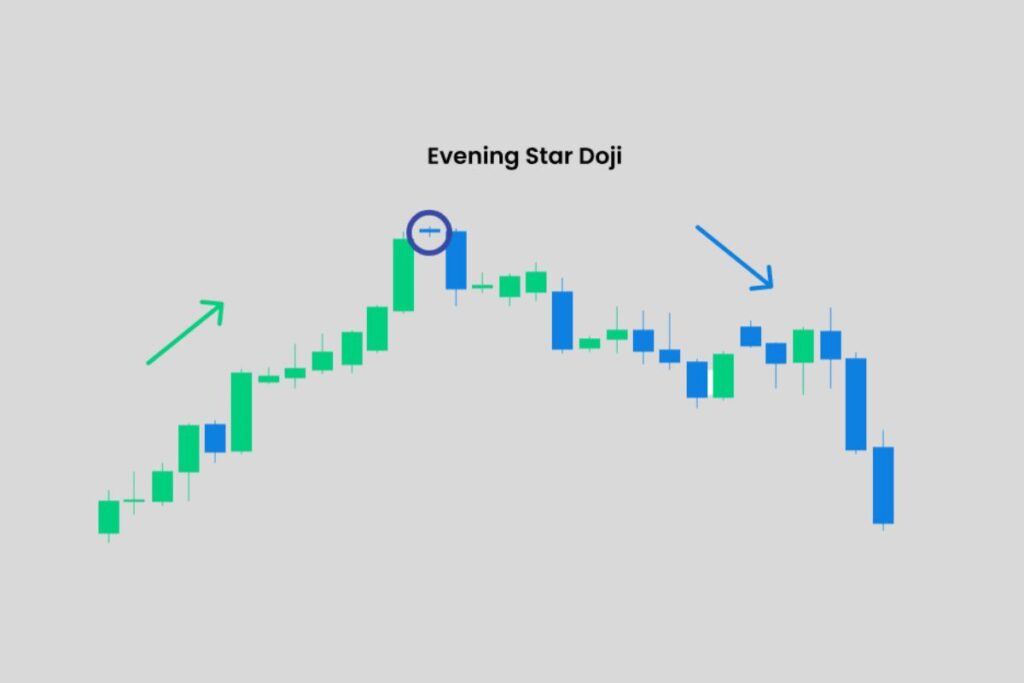
- The formation of the first long bullish candle suggests strong buyer momentum.
- The following candle is a small-bodied Doji, suggesting indecision among traders. The buying pressure starts to fade.
- The third candle confirms the bearish reversal after it closes well below the midpoint of the first candle.
The outcome of the Trend
The outcome of the pattern suggests that the price has reversed and entered a strong downtrend.
2. 4-Hour Chart GBP/JPY
- A strong bullish candle is formed in a sustained uptrend.
- The next candle is a spinning top with a tiny body. Its formation suggests a tug-of-war between buyers and sellers.
- The third candle is a bearish engulfing candle that closes below the first candle’s midpoint. This formation suggests a strong downtrend.
The Outcome of the Trend
The price has declined sharply, which has provided an opportunity to shorten the trade with a stop-loss placed above the spinning top.
3. Weekly Chart AUD/USD
- The first candle is long and bullish and formed at the peak of an uptrend.
- The second candle is a small-bodied Doji, formed near the resistance level.
- The third candle is a long, bearish candle that closes below the midpoint of the first bullish candle.
The Outcome of the Trend
The pattern formation led to a strong downtrend over several weeks. This can be ideal for swing traders looking for extended moves.
Common Mistakes to Avoid When Trading Evening Star
The evening star is a powerful reversal signal that can help traders with a timely exit from a trade or open a short position. However, the effectiveness of this pattern depends a lot on its identification and trade execution. Let us see some common mistakes to avoid when trading evening stars.
| Issue | Mistake | Why it can be an issue | Possible Solution |
| Trading without the confirmation. | Traders may enter a trade immediately after spotting the evening star without waiting for confirmation. | It may be a fake reversal, and the uptrend continues. | Confirm the Pattern: Ensure that the third candle closes below the midpoint of the first bullish candle. |
| Misjudging the second candle. | Traders may misinterpret the size and position of the second candle. | If the second candle is large-bodied, it will undermine the pattern’s credibility. A larger candle means strong momentum rather than indecision. | The second candle must be small-bodied, like a Doji or spinning top. |
| Neglecting Risk Management | Traders place the stop-loss too close or enter with excessive position sizes. | The price may retest the resistance zone before making a downward movement. This may trigger tight stop-losses. | Traders can keep the stop-loss above the high of the evening star. |
| Ignoring timeframe suitability | Traders may apply the pattern on lower time frames where noise is prevalent. | Traders should know lower timeframes are prone to false signals due to random price fluctuations. | Traders should focus on higher timeframes. For example, 4 hours daily. |
Conclusion
In this blog, we have discussed how to trade the evening star candlestick pattern. The pattern is built on the price chart, providing significant assistance to traders in exiting long trades or opening short trades. This pattern’s reliability increases when combined with other technical indicators. In the end, it serves as a reliable indicator, but one should understand the correct way to interpret it.