Every forex trader wants to set up a nice strategy to work in the market and make profitable trades. Setting up unique strategies depends on many aspects, and working to make a substantial technical analysis is one of them. In the same context, let me brief you about the Volume Weighted Average Price (VWAP), which is an excellent and versatile tool. It is used by forex traders, institutional traders, portfolio managers, and retail investors. The specialty of this tool is that it combines price and volume into a single indicator. It gives a clear view of market trends and provides more opportunities to trade. This blog is dedicated to the use of VWAP indicators in trading.
The tool reading acts as a benchmark that helps forex traders. It helps them to understand whether the current price of the asset is above or below the average price. Several currency traders also believe it works better than the Moving Averages (MA). The moving averages consider only prices over specific periods, while VWAP also incorporates the volume of the trades as well. This quality makes it a preferred tool by traders. Especially to identify and evaluate market sentiments, entry and exit points, and gauge the efficiency of trades.
What is the VWAP Indicator in Forex Trading?
It is an indicator used by forex traders to solidify their technical analysis. Traders use the Volume Weighted Average Price (VWAP) to determine the average price of an asset at which it is traded throughout the day.
Formula to calculate VWAP = ∑(Price*Volume)/∑(Volume)
In this case, Price = Typical price (High + Low + Close)/3
Volume = Number of units traded (per interval)
Did you know? Retail and institutional traders make extensive use of the VWAP. It is a great tool for identifying market trends and entry/exit points of a trade.
Key Features of VWAP
| Features | Explanation |
| Price and Volume Integration | Traders consider VWAP more useful than moving averages as it considers both the volume and the price. Considering all factors reflects market activity with greater accuracy. |
| Dynamic Indicator | VWAP adapts to market changes better than other technical indicators. It updates throughout the day and guides you better while trading. |
| Acts as a Baseline for Trading Decisions | Traders use the tool to determine if the prices are overvalued or undervalued for a day’s trading. |
How to Trade Using VWAP in the Forex Market
The Volume Weighted Average Price (VWAP) is a dynamic tool used during technical analysis of the market. Let us see how forex traders utilize it.
| Features | Explanation |
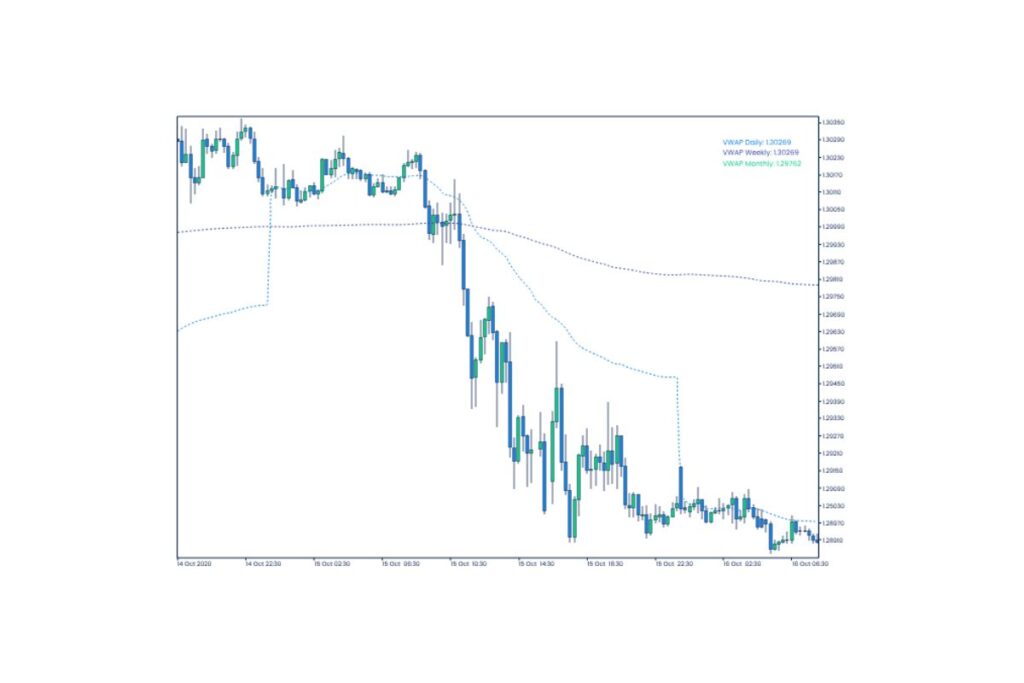
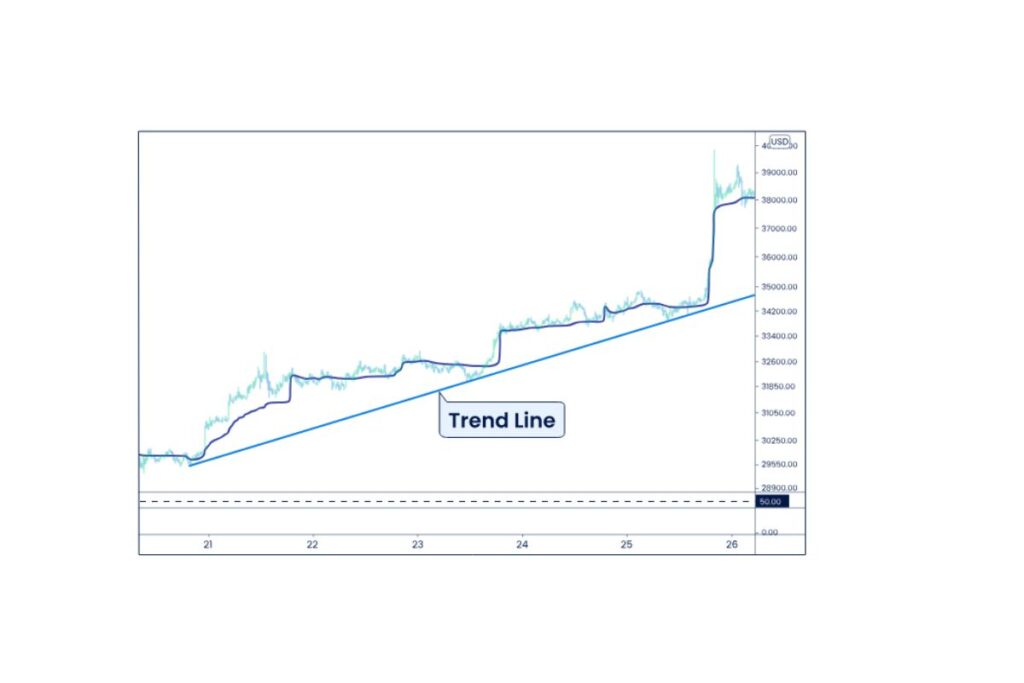
| Confirming the Trend | 1. It suggests a bullish sentiment or uptrend if the price floats above the VWAP. 2. It suggests a bearish sentiment or downtrend if the price is below the VWAP. |
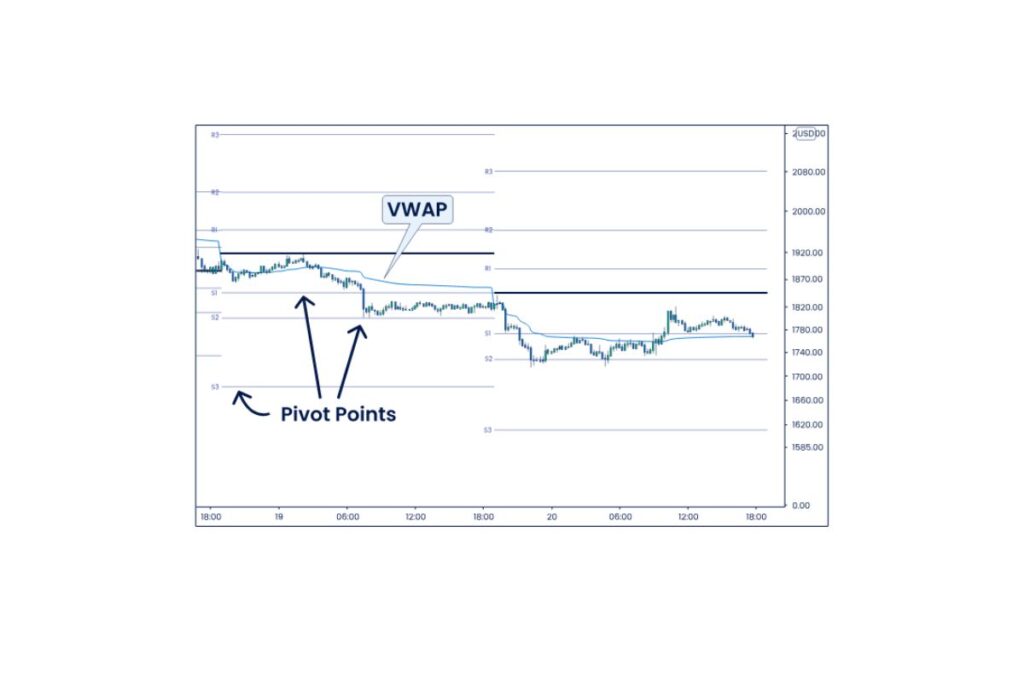
| Support/Resistance | VWAP acts as dynamic support/resistance. Traders need to monitor price reactions around the VWAP line closely. |
| Executing the Trade | Institutional traders use this tool to minimize the market impact. Traders do it by making sure trades occur close to the average price of the day. |
| Mean Reversion | Some traders consider a deviation from VWAP a potential reversal point. This seems possible when the price moves further from the VWAP line, showing a big gap between the two. |
How the VWAP Indicator is Used
VWAP is the most popular tool used in forex trading to assess the average price of an asset with the trading volume. Traders use it to get better insight into the market and make a profitable trade. Let us see how traders use the VWAP indicator.
1. Measuring Market Direction
Buying Opportunities: When the price floats above the VWAP line, it suggests bullish market conditions. Traders can start buying at this point.
Selling or Shorting: When the price is below the VWAP line, it suggests bearish market conditions. Traders may consider selling or shorting at this point.
2. Setting Support and Resistance
The VWAP line acts as a dynamic support/resistance level. Price bounces off this line, which creates buying/selling opportunities.
3. Intraday Trading
Did you know? VWAP resets daily.
It is favorable for intraday trading. Traders can gauge real-market conditions and trends.
4. Filtering False Signals
VWAP can help filter out false breakouts.
Want to know how? Traders avoid trading as the price moves far away from the VWAP line. This could denote overbought or oversold conditions.
Indicators to Use With VWAP
Forex trading is all about optimally using the available tools and utilizing them for a profitable trade. When talking about profitability in a forex trade, traders combine indicators to get a precise insight into the market. Let us see what indicators a trader can use with VWAP.
| Indicators | Explanation |
| Moving Averages (MAs) | Use Moving Averages like SMA and EMA to help identify long-term trends. Combining both 1. Traders can use VWAP to confirm intraday price levels. Traders can use Moving Averages for trend confirmation. 2. Traders see the crossover between these two as a potential trend reversal. |
| Bollinger Bands | Use: Bollinger Bands predict price levels and price volatility. Combining both 1. The price indicates overextension if it touches the upper Bollinger Band and is far above VWAP. 2. The price indicates Market Reversion if it moves towards VWAP from the bands. |
| Moving Average Convergence Divergence (MACD) | Use: MACD identifies potential trend reversals and the momentum of the market. Combining both 1. Use VWAP for short-term directional bias. 2. Trade entries or exits: by MACD crossovers and divergences. |
| Relative Strength Index (RSI) | Use: Traders use RSI to measure the momentum of the market. It is also used to identify overbought and oversold conditions. Combining both 1. Pullback: A price above VWAP and RSI indicates an overbought condition. 2. Reversal: A price below VWAP and RSI indicates an oversold condition. |
| Fibonacci Retracement | Use: Fibonacci Retracement identifies potential support/resistance levels. Combining both 1. Using both together creates a foolproof strategy to identify strong support/resistance zones. 2. For high profitability, traders can enter near points where VWAP aligns with a Fibonacci level. |
| Average True Range (ATR) | Use: Traders use the Average True Range to measure the volatility in the market. Combining both 1. Traders can do risk management and set stop-loss or take-profit levels by using ATR around VWAP-based trades. 2. Stay cautious near VWAP levels with higher ATR values, as they suggest large price swings. |
| Stochastic Oscillator | Use: The Stochastic Oscillator measures market momentum and potential trend reversals. Combining both 1. Reversal: Stochastic Oscillator = Overbought and the price is far above VWAP. 2. Upward price movement: Stochastic Oscillator = oversold and price near VWAP. |
Pro Tip: It is very unlikely when one indicator generates a profitable trade. Combine VWAP with the above-mentioned indicators to align with market conditions, trading styles, and timeframes.
Conclusion
In this blog, we have understood the importance of the VWAP indicator in trading. The Volume Weighted Average Price is a powerful tool that forex traders are using. They use it to assess the market, seek fair value, and optimize trade entries/exits. Traders can integrate the VWAP with other indicators to get a better insight into the market. The tool can act as both a trend-following and a mean-reversion indicator. So, it suits many trading strategies.